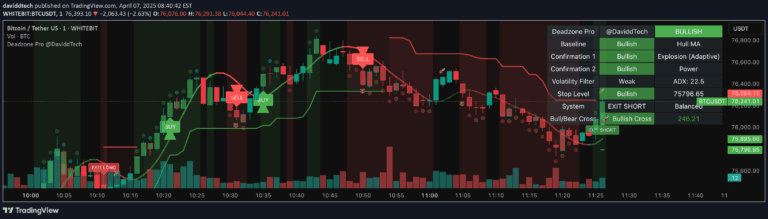
FRAMA is an adaptive moving average indicator that adjusts smoothing based on market volatility, generating trading signals by analyzing price position relative to the moving average line.
Explore complementary indicator rolesHow it works
The FRAMA indicator calculates a dynamic moving average by adapting its smoothing period according to market volatility. It uses a fractal dimension calculation to determine the smoothing factor, which allows the indicator to respond more quickly in trending markets and more slowly in ranging markets.
The indicator tracks price movement relative to the FRAMA line, generating buy and sell signals based on the price's position. When the price crosses above or below the FRAMA line, it can indicate potential trend changes or trading opportunities, with additional confirmation possible through candlestick pattern recognition.
Why it may be useful
FRAMA provides traders with a more responsive and adaptive technical analysis tool compared to traditional moving averages. By dynamically adjusting its smoothing period, it can capture market trends more effectively, reducing lag and providing more timely signals in different market conditions.
The indicator's ability to integrate candlestick pattern recognition adds an extra layer of confirmation to trading signals. This approach helps traders make more informed decisions by combining trend analysis with pattern-based insights, potentially improving trade entry and exit strategies.
When to explore it
FRAMA is most effective in markets with clear trending characteristics, where price movement shows consistent directional momentum. It works well in both bullish and bearish markets, adapting its sensitivity to capture short-term and medium-term trend changes across various financial instruments.
Traders should use FRAMA in conjunction with other technical indicators and fundamental analysis to validate signals. It is particularly useful for active traders who require a dynamic and responsive trend-following tool that can quickly adapt to changing market volatility and momentum.
Keep exploring
What we’ve verified
Access, alerts and repainting behaviour have not been independently verified for this indicator. Check the creator’s current publication and settings.
General descriptions and classifications are recovered research. Verified details above identify the specific checks we have completed. Check the creator’s current publication for later changes.