Multi-Timeframe FVG [TFO]
A multi-timeframe Fair Value Gap (FVG) indicator that identifies potential price reaction zones by analyzing overlapping price gaps across different chart periods.
Explore 11,183 indicators. Filter beyond the obvious.
Discover the tools that fit the way you trade.
11,183 tools to explore
A multi-timeframe Fair Value Gap (FVG) indicator that identifies potential price reaction zones by analyzing overlapping price gaps across different chart periods.
Advanced machine learning trading strategy utilizing signal processing techniques and custom moving averages to generate precise housing market trading signals and performance metrics.
FRAMA is an adaptive moving average indicator that adjusts smoothing based on market volatility, generating trading signals by analyzing price position relative to the moving average line.
Advanced moving average system using floating-point mathematics that enables fractional period calculations, creating more responsive and precise trend indicators with dynamic adaptive capabilities.
The HRC indicator measures hash rate trend strength by comparing short and long-term simple moving averages to identify potential miner capitulation and market conditions.
A daily technical analysis tool for SPY traders using Average True Range to plot potential breakout and take profit levels across multiple price zones.
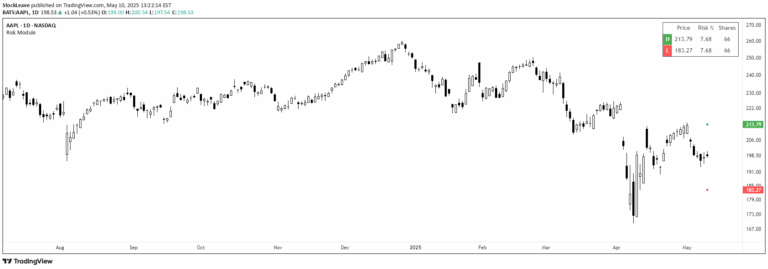
A risk management tool that calculates optimal position sizes, suggests automated stop-loss levels, and helps traders manage trading risk by providing strategic entry and exit guidance.
An advanced moving average technique that uses interpolation to calculate smoother trend lines with fractional length precision, offering more nuanced market analysis.
A trading script designed to display price for extremely low-value cryptocurrency assets using subscript notation, making small decimal values more readable and comprehensible.
Fractional differentiation is an advanced mathematical technique that reveals hidden market patterns by adjusting the differentiation order to balance signal clarity and data memory.
An analysis of price decimal attraction points across different stocks, examining whether whole or fractional prices act as significant market entry or exit zones.
A risk management tool that calculates optimal position sizing and stop placement using Average True Range (ATR) to ensure consistent risk across different market conditions.
Likes, views, and comments are historical TradingView snapshots. They describe attention, not trading performance.