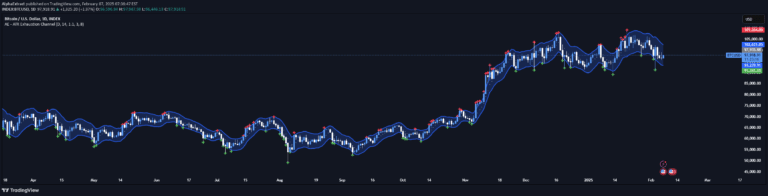
The HRC indicator measures hash rate trend strength by comparing short and long-term simple moving averages to identify potential miner capitulation and market conditions.
Explore complementary indicator rolesHow it works
The Hash Rate Capitulation (HRC) indicator calculates the fractional difference between a short-term (21-day) and long-term (105-day) simple moving average of Bitcoin's hash rate. When the short-term SMA crosses below the long-term SMA, it signals that miners are removing significant computational power from the network.
This crossover suggests a potential miner capitulation, which occurs when mining becomes less profitable and miners start shutting down equipment. The indicator provides insight into the underlying network dynamics by tracking changes in computational resources dedicated to Bitcoin mining.
Why it may be useful
The HRC indicator offers traders a unique perspective on Bitcoin market conditions by revealing potential periods of miner stress and network transformation. It can help investors understand when miners might be experiencing economic challenges, which could correlate with broader market sentiment and price movements.
By identifying potential capitulation events, traders can gain insights into possible market bottoms and future price recoveries. Historically, these periods have sometimes preceded significant price increases, making the HRC a valuable tool for understanding long-term market cycles and potential investment opportunities.
When to explore it
The HRC indicator is most effective when analyzing long-term Bitcoin market trends and seeking potential investment entry points during periods of market consolidation. It works best for swing traders and long-term investors who are interested in understanding broader network dynamics and potential market turning points.
Traders should use the HRC in conjunction with other technical and fundamental analysis tools to confirm signals and make more informed trading decisions. It is particularly useful during extended bear markets or periods of significant mining industry changes.
Keep exploring
What we’ve verified
Access, alerts and repainting behaviour have not been independently verified for this indicator. Check the creator’s current publication and settings.
General descriptions and classifications are recovered research. Verified details above identify the specific checks we have completed. Check the creator’s current publication for later changes.