Sector Relative Strength
A systematic approach to comparing sector performance against the S&P 500 by calculating ratio changes and Z-scores to identify market leadership and potential investment opportunities.
Explore 11,183 indicators. Filter beyond the obvious.
Discover the tools that fit the way you trade.
11,183 tools to explore
A systematic approach to comparing sector performance against the S&P 500 by calculating ratio changes and Z-scores to identify market leadership and potential investment opportunities.
An ATR-based indicator that visually displays stop-loss ranges by creating a volatility-adjusted zone above or below price, helping traders set dynamic risk management levels.
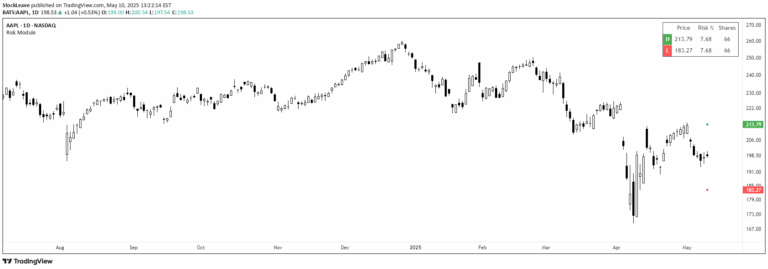
A risk management tool that calculates optimal position sizing and stop placement using Average True Range (ATR) to ensure consistent risk across different market conditions.
A momentum tracking tool that identifies stock price movements by analyzing price changes across different timeframes and calculating momentum through multiple specialized metrics.
Linear Regression Slope quantifies price trend direction by fitting a regression line to closing prices and calculating its slope, normalized by Average True Range.
Likes, views, and comments are historical TradingView snapshots. They describe attention, not trading performance.