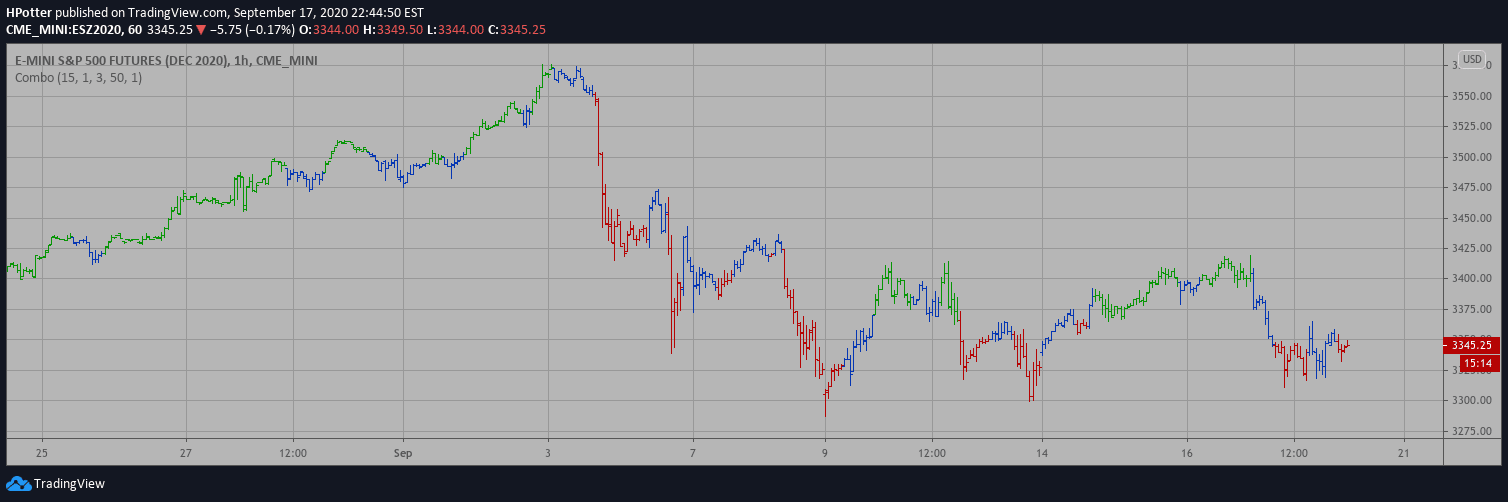
A combo trading strategy combining price action and stochastic oscillator signals to identify market trends and potential entry/exit points using two distinct analytical approaches.
Explore complementary indicator rolesHow it works
The strategy operates through two interconnected methods. First, it analyzes price movement over two days, comparing current close prices to previous closes. Simultaneously, it integrates the 9-day Stochastic Oscillator to assess market momentum. Buy signals occur when close prices are higher than previous closes and the Stochastic Slow Oscillator is below 50.
Sell signals emerge when close prices drop below previous closes and the Stochastic Fast Oscillator exceeds 50. The Fractal Chaos Bands Indicator further validates trend strength by mapping price highs and lows to identify market stability and directional movements
Why it may be useful
This strategy provides traders with a comprehensive market analysis approach by combining multiple indicators. It helps reduce false signals by cross-referencing price action with momentum oscillators. The Fractal Chaos Bands add an additional layer of trend confirmation, filtering out insignificant price fluctuations.
By integrating different analytical tools, traders can make more informed decisions, potentially improving entry and exit timing. The method acknowledges market complexity while offering a structured approach to identifying trading opportunities
When to explore it
This strategy is most effective in markets showing clear directional movements and moderate volatility. It works best for traders seeking a systematic approach to trend identification. The method is particularly useful during periods of consistent market trends, where price movements demonstrate predictable patterns.
Traders should apply this strategy in markets with sufficient liquidity and when multiple timeframe confirmations are present. It is less effective in extremely choppy or range-bound markets where trend signals become less reliable
Keep exploring
What we’ve verified
Access, alerts and repainting behaviour have not been independently verified for this indicator. Check the creator’s current publication and settings.
General descriptions and classifications are recovered research. Verified details above identify the specific checks we have completed. Check the creator’s current publication for later changes.