
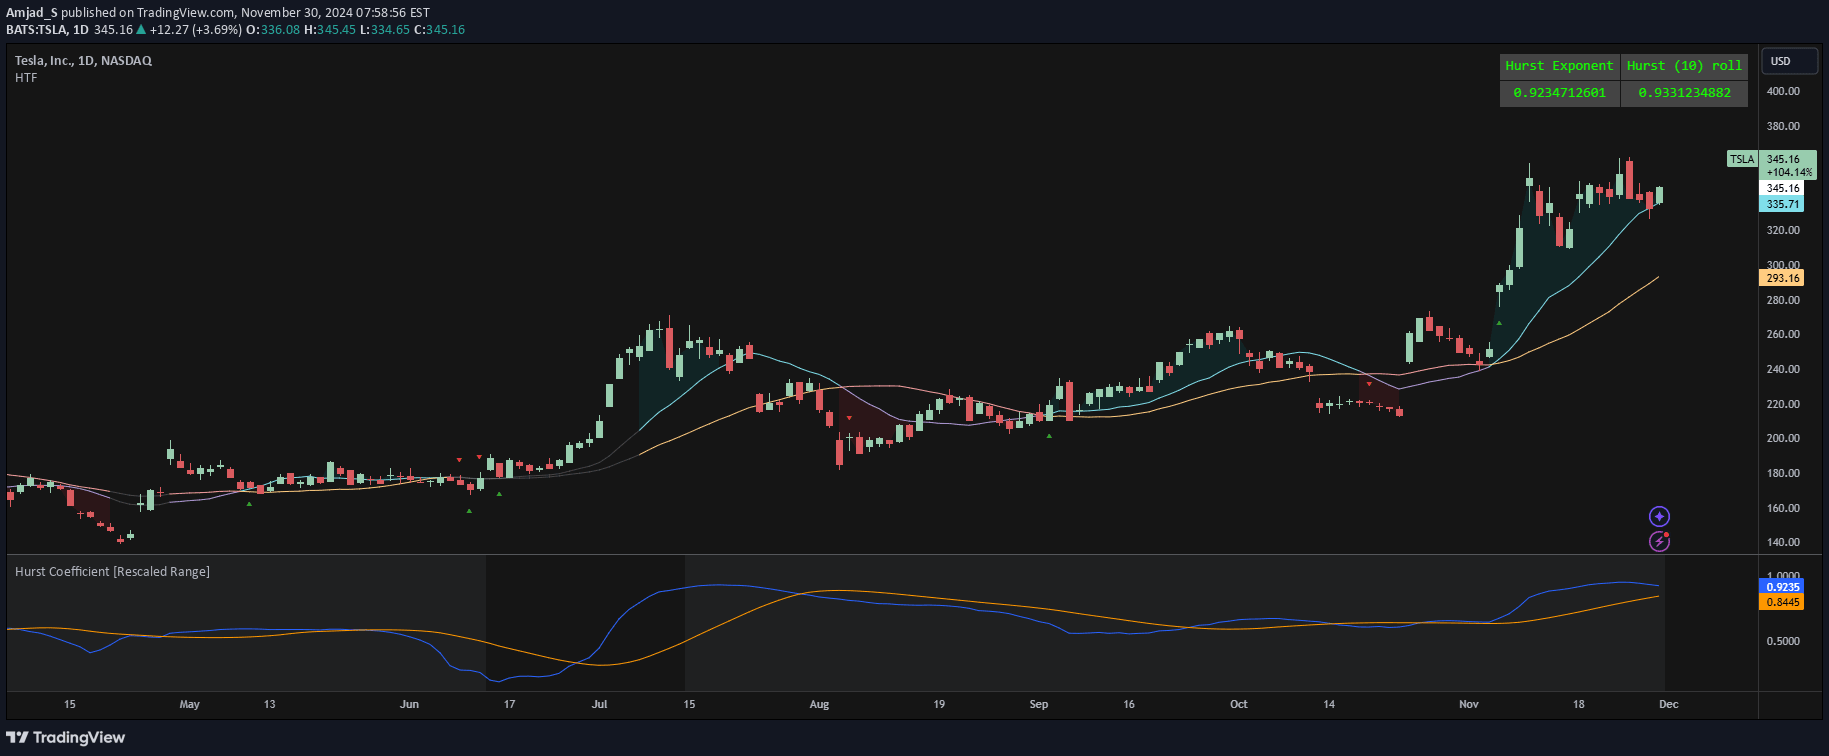
A trading indicator using the Hurst Exponent to categorize market states, identifying trending, random, and mean-reverting markets by analyzing time series auto-correlation.
Explore complementary indicator rolesHow it works
The Hurst Exponent (H) analyzes time series data to segment market states based on auto-correlation. When H > 0.5, the market is considered trending, indicating persistent price movement in a specific direction. When H = 0.5, the market exhibits random geometric Brownian motion, suggesting no clear directional bias.
The indicator combines the Hurst Exponent with a Volume-Adjusted Weighted Moving Average (VAWMA) to provide additional trend confirmation. By comparing fast and slow VAWMA lines and their relationship to price action, traders can identify bullish or bearish market conditions within trending environments.
Why it may be useful
The Hurst Exponent provides traders with a sophisticated method to understand market dynamics beyond traditional trend-following techniques. By quantifying the persistence and randomness of price movements, it offers insights into market behavior that can help traders make more informed decisions about trend strength and potential market regime changes.
This approach goes beyond simple visual trend analysis by mathematically categorizing market states, allowing traders to distinguish between genuine trends and random price fluctuations. The integration with VAWMA adds an additional layer of confirmation, helping to filter out market noise and identify more reliable trading opportunities.
When to explore it
The Hurst Exponent indicator works best in markets with clear directional movements, particularly in highly liquid and actively traded financial instruments. It is most effective when used across multiple timeframes to confirm trend strength and potential reversals, providing a more nuanced view of market dynamics than traditional trend-following methods.
Traders should be cautious when using this indicator in choppy or range-bound markets, where the Hurst Exponent may provide less reliable signals. It is particularly useful for day and swing traders who seek to understand underlying market trends and filter out short-term noise, potentially improving entry and exit timing for their trading strategies.
Keep exploring
What we’ve verified
Access, alerts and repainting behaviour have not been independently verified for this indicator. Check the creator’s current publication and settings.
General descriptions and classifications are recovered research. Verified details above identify the specific checks we have completed. Check the creator’s current publication for later changes.


