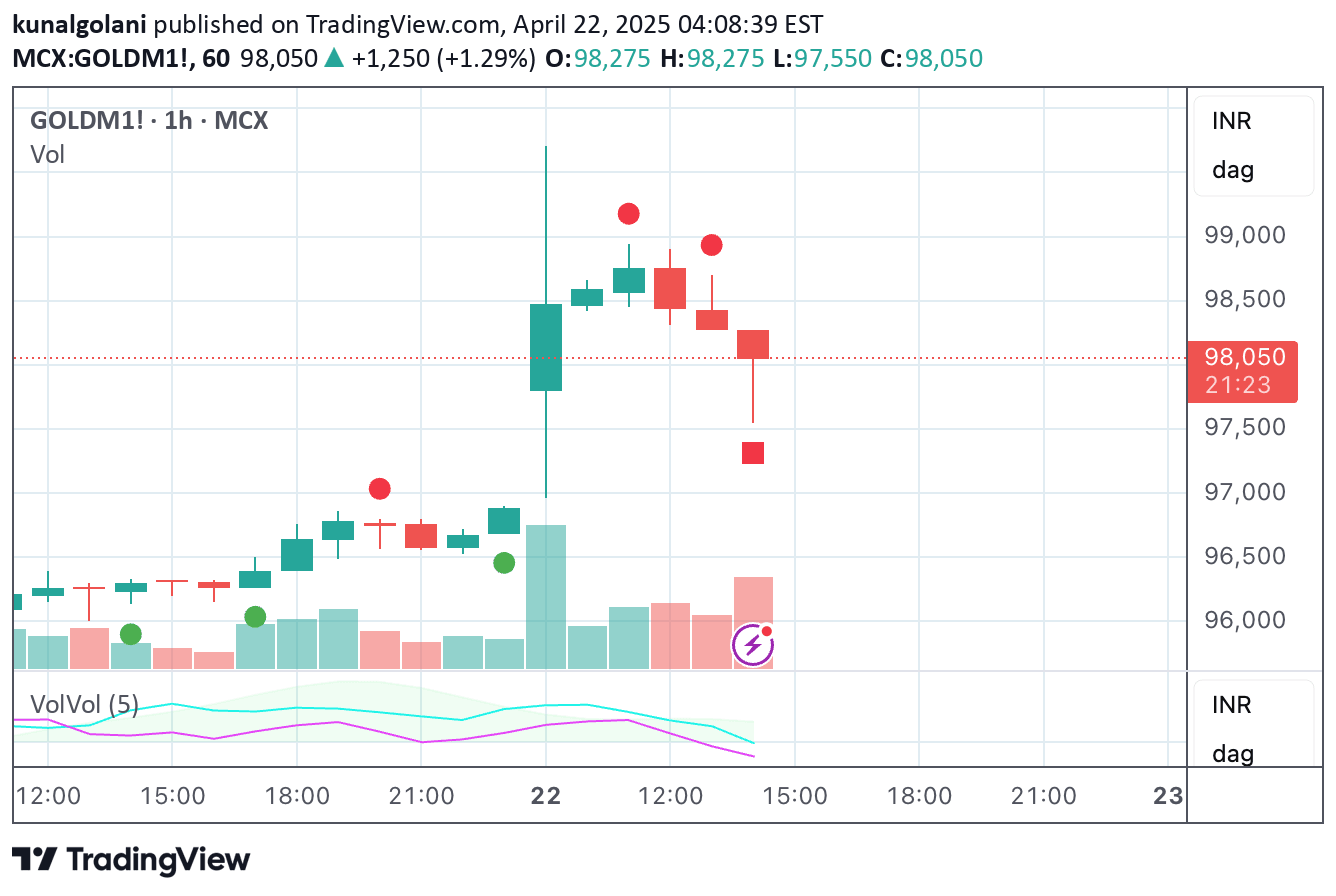
A sophisticated trend-following system using Radial Basis Function kernel smoothing and Kijun-Sen calculation to provide refined price trend analysis with dynamic volatility adaptation.
Explore complementary indicator rolesHow it works
The RBF Kijun Trend System employs advanced mathematical techniques to smooth price data and detect trends. It uses a Radial Basis Function kernel to calculate weighted averages of price, creating a more refined representation of market movement that reduces noise and false signals.
The system incorporates Kijun-Sen calculations to establish trend direction, computing the average of highest highs and lowest lows over a specified period. Additionally, it integrates Average True Range (ATR) to dynamically adjust smoothing and create adaptive upper and lower bounds that account for market volatility.
Why it may be useful
By combining sophisticated mathematical methods, this indicator provides traders with a more nuanced view of market trends that goes beyond traditional trend-following approaches. The RBF kernel smoothing helps minimize the impact of market noise, allowing traders to focus on more meaningful price movements and potential trend shifts.
The integration of ATR and Kijun-Sen calculations enables dynamic adaptation to changing market conditions, offering traders a flexible tool that can adjust to different volatility environments. This approach helps reduce false signals and provides more reliable trend identification across various market scenarios.
When to explore it
The RBF Kijun Trend System is most effective in markets with clear trending characteristics, where price movement shows consistent directional momentum. It performs exceptionally well in liquid markets with moderate volatility, such as major forex pairs, stock indices, and high-volume commodities where trend persistence is more likely.
Traders should consider using this system during periods of stable market conditions and avoid it during extreme market events or choppy, range-bound markets. The indicator's strength lies in its ability to smooth out short-term price fluctuations and provide a clearer view of underlying market trends.
Keep exploring
What we’ve verified
Access, alerts and repainting behaviour have not been independently verified for this indicator. Check the creator’s current publication and settings.
General descriptions and classifications are recovered research. Verified details above identify the specific checks we have completed. Check the creator’s current publication for later changes.