
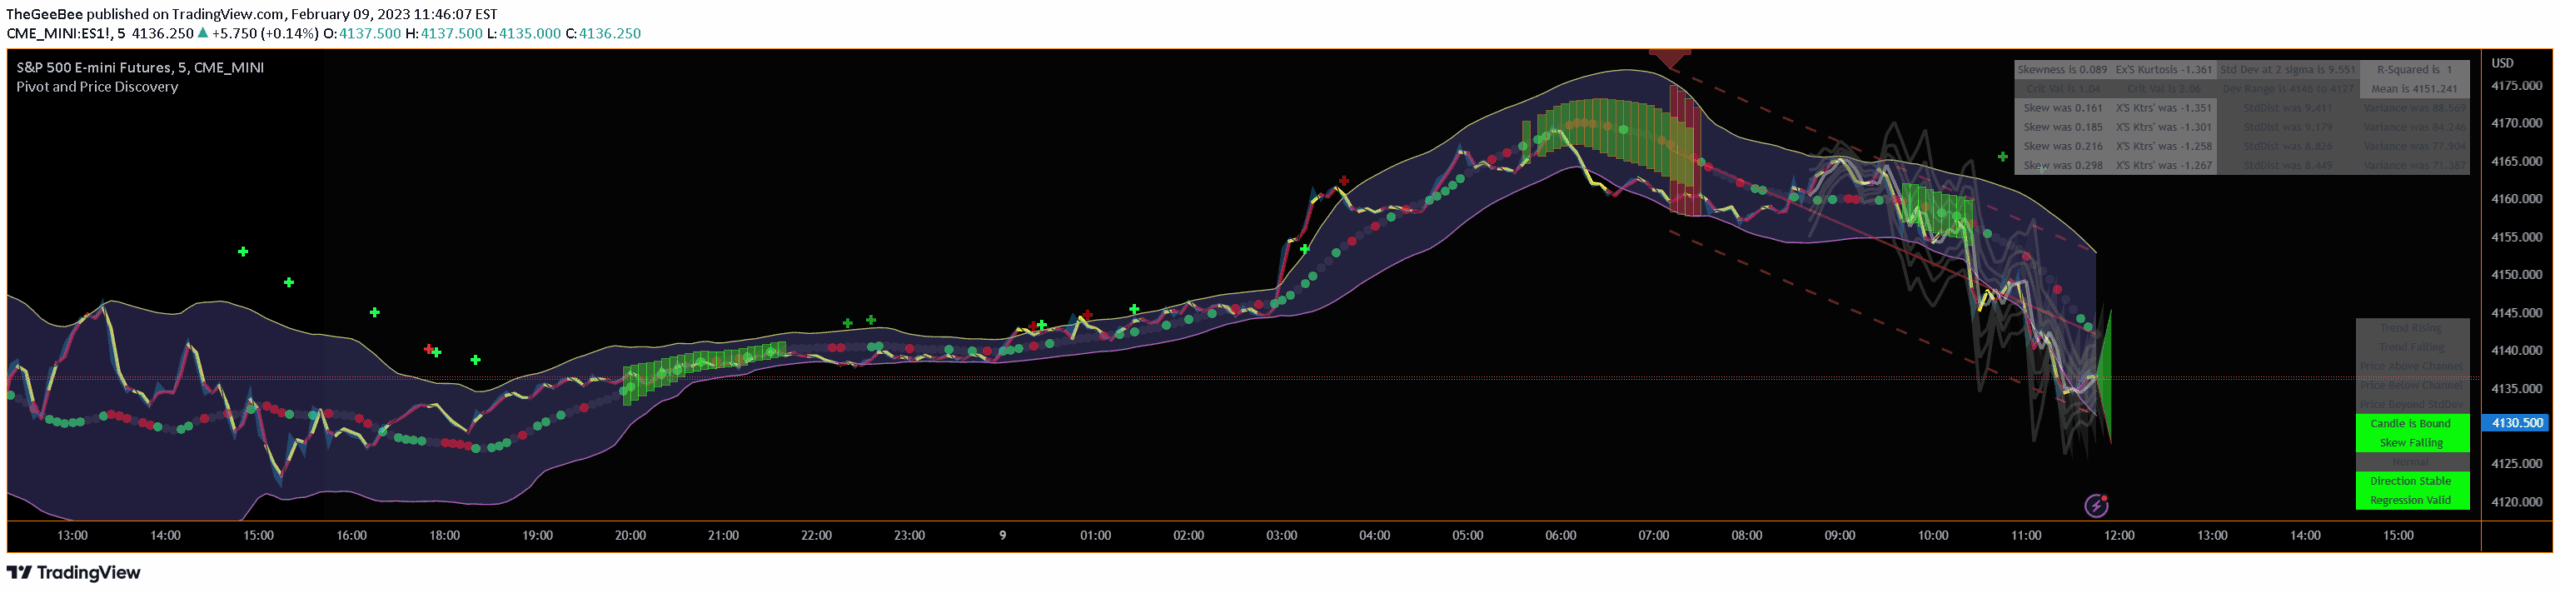
A population sampled linear regression model that analyzes price momentum, distribution moments, and potential pivot points using statistical analysis and standard deviation tracking.
Explore complementary indicator rolesHow it works
The signal uses linear regression on population samples to create a dynamic price analysis model. It tracks regression line characteristics like skew, kurtosis, variance, and mean to understand price movement. Momentum lines indicate pivot trends, with red signaling reducing pivots and grey representing trend continuation.
A forward-looking trend triangle captures standard deviation ranges, helping predict potential price shifts. By analyzing statistical moments, traders can assess the probability of upcoming market pivots and trend changes
Why it may be useful
This signal provides traders with a sophisticated statistical approach to understanding market dynamics beyond traditional technical indicators. By incorporating advanced statistical measures, it offers deeper insights into price behavior and potential trend reversals.
The model helps traders identify momentum shifts, assess pivot probabilities, and understand underlying market distributions. Its multi-dimensional analysis allows for more nuanced trading decisions, reducing reliance on single-dimensional trend indicators and providing a more comprehensive market view
When to explore it
The signal works best on timescales greater than 5 minutes, with careful adjustment of lookback length for different timeframes. It is particularly effective for traders seeking advanced statistical analysis of market movements.
Traders should be cautious when applying this method to very short timeframes or periods with low trading volume. The signal is most reliable when trade volume is consistent and representative, particularly during regular trading hours. Futures markets may require additional volume sensitivity considerations
Keep exploring
What we’ve verified
Access, alerts and repainting behaviour have not been independently verified for this indicator. Check the creator’s current publication and settings.
General descriptions and classifications are recovered research. Verified details above identify the specific checks we have completed. Check the creator’s current publication for later changes.


