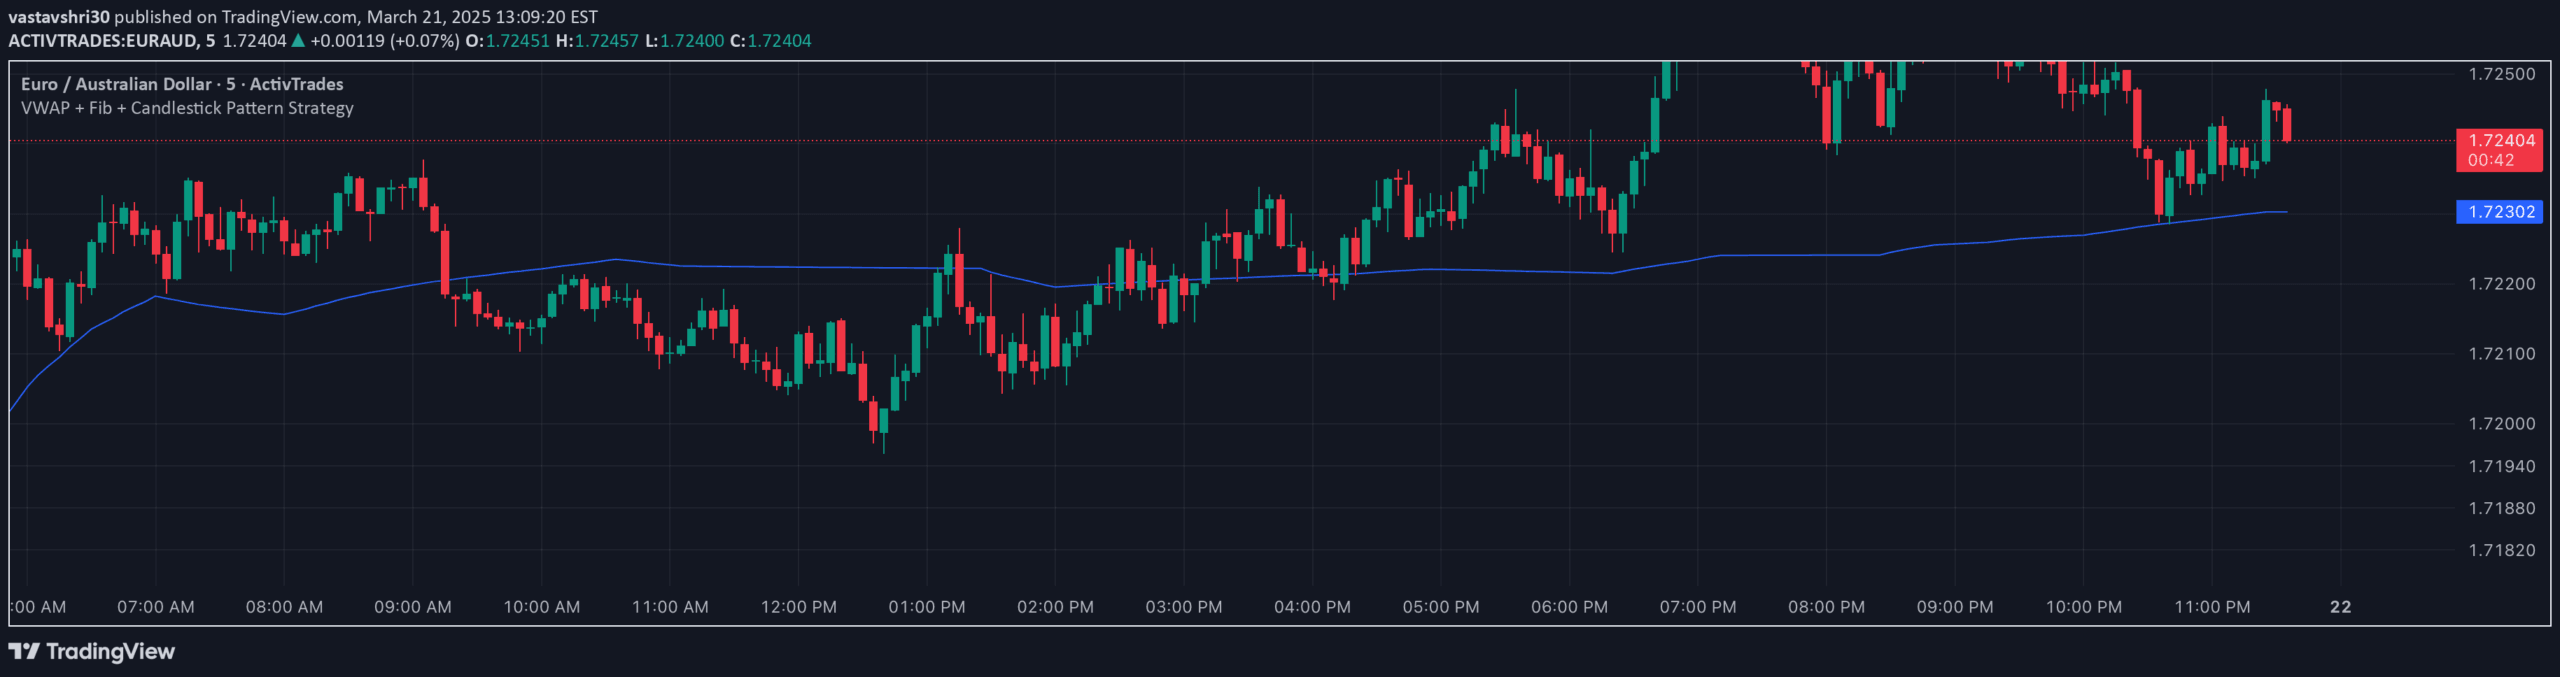
A sophisticated trading strategy combining Anchored VWAP, Fibonacci Retracement, and Candlestick Patterns to identify high-quality trade entries with precise confluences and risk management.
Explore complementary indicator rolesHow it works
The indicator starts by identifying pivot points in price action and anchoring the Volume Weighted Average Price (VWAP) from these significant levels. It then overlays Fibonacci retracement levels at key percentages (0.382, 0.5, 0. 618, 0.786) to establish potential support and resistance zones.
Simultaneously, it scans for specific candlestick patterns like Pin Bars, Engulfing Candles, and Hammer Candles that signal potential trend reversals. When these elements converge, the strategy generates trading signals with precise entry points, highlighting areas of high-probability trade setups
Why it may be useful
This strategy provides traders with a multi-dimensional approach to market analysis by combining trend, momentum, and price action indicators. By integrating VWAP, Fibonacci levels, and candlestick patterns, traders gain a more comprehensive view of market dynamics.
The approach reduces emotional trading by offering objective, rules-based entry and exit points. It helps identify high-probability trades with enhanced confluence, improving overall trading accuracy and potential profitability
When to explore it
The strategy works best in markets with clear trending behavior and moderate volatility. It is particularly effective in liquid markets like forex, major stock indices, and high-volume commodities.
Traders should apply this method during periods of established trend momentum, avoiding choppy or ranging markets. Peak performance occurs when price is approaching key Fibonacci levels near the Anchored VWAP, creating multiple confirmation points for potential trend reversals or continuations
Keep exploring
What we’ve verified
Access, alerts and repainting behaviour have not been independently verified for this indicator. Check the creator’s current publication and settings.
General descriptions and classifications are recovered research. Verified details above identify the specific checks we have completed. Check the creator’s current publication for later changes.