
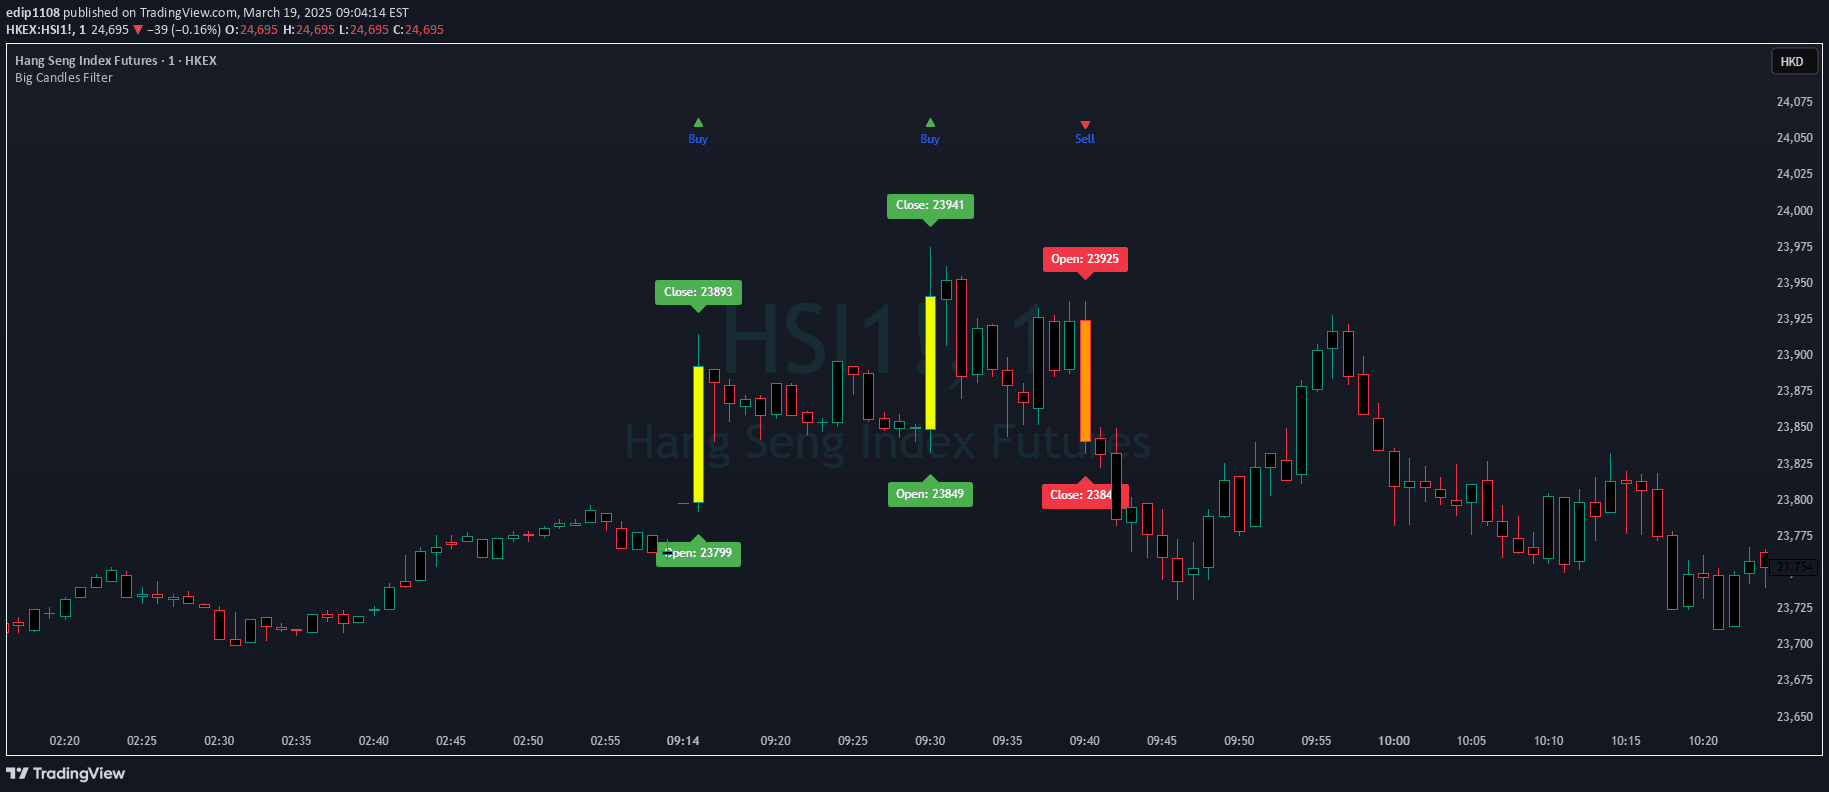
A trading signal that identifies significant price movements by marking large candles with color-coded buy and sell triangles based on candle body size and price direction.
Explore complementary indicator rolesHow it works
The signal analyzes individual price candles by measuring their body size against a predefined barHeight threshold. Bullish candles with a body larger than the threshold are marked with a green 'Buy' triangle, while bearish candles exceeding the same threshold are marked with a red 'Sell' triangle.
The body is calculated by the distance between open and close prices, not by the total candle range. This method focuses on identifying significant price movements within a single candle period, providing visual cues about potential trading opportunities
Why it may be useful
This signal helps traders quickly identify meaningful price movements and potential trend changes by visually highlighting candles with substantial price shifts. By distinguishing between large and small candles, traders can filter out minor price fluctuations and focus on more significant market movements.
The color-coded triangles provide immediate visual feedback about the candle's direction and significance, allowing traders to make faster and more informed decisions about potential entry and exit points
When to explore it
The signal works best in markets with clear trending characteristics and moderate volatility. It is particularly useful during day trading and swing trading scenarios where capturing significant price movements is crucial.
Traders should apply this signal in liquid markets with consistent price action, such as major forex pairs, blue-chip stocks, and popular stock indices. It is most effective when combined with other technical indicators to confirm signals and reduce false positives
Keep exploring
What we’ve verified
Access, alerts and repainting behaviour have not been independently verified for this indicator. Check the creator’s current publication and settings.
General descriptions and classifications are recovered research. Verified details above identify the specific checks we have completed. Check the creator’s current publication for later changes.


