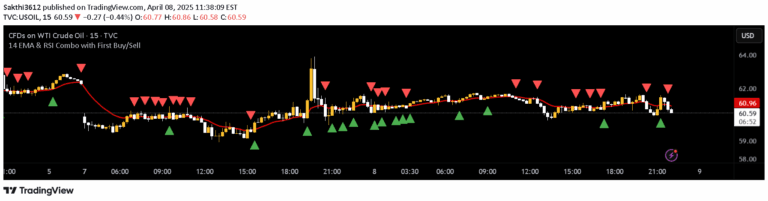
A comprehensive trading indicator that combines candlestick strength analysis with RSI and OBV to identify potential market trend reversals and provide insights into bullish and bearish market dynamics.
Explore complementary indicator rolesHow it works
The Candlestick Strength and Weakness (CSW) indicator operates by analyzing individual candlesticks and quantifying their bullish and bearish characteristics. It calculates strength and weakness based on the candlestick's body range, upper shadow, and lower shadow, creating two distinct lines that represent the market's dynamic pressure.
The indicator further enhances its analysis by incorporating Relative Strength Index (RSI) and On-Balance Volume (OBV) to validate potential trend reversals. It compares the strength and weakness lines, checks RSI levels for overbought or oversold conditions, and evaluates OBV in relation to its 20-period simple moving average to generate comprehensive trading signals.
Why it may be useful
The CSW indicator provides traders with a multi-dimensional approach to market analysis, combining visual candlestick interpretation with quantitative momentum and volume indicators. By breaking down each candlestick's strength and weakness, traders gain deeper insights into market sentiment and potential price movements that might not be apparent through traditional single-indicator analysis.
This comprehensive approach allows traders to make more informed decisions by considering multiple market factors simultaneously. The indicator's ability to integrate candlestick patterns, momentum oscillators, and volume analysis offers a more holistic view of market dynamics, potentially reducing false signals and improving overall trading strategy effectiveness.
When to explore it
The CSW indicator is most effective in markets with clear trending characteristics, where price movements show distinct bullish or bearish momentum. It performs particularly well in liquid markets with sufficient trading volume, such as major stock indices, forex pairs, and actively traded commodities where price action is more predictable.
Traders should utilize this indicator during periods of potential trend reversal, when traditional price action suggests a possible change in market direction. It is especially useful when combined with other technical analysis tools and during times of significant market volatility, where its multi-faceted approach can provide additional confirmation of potential trading opportunities.
Keep exploring
What we’ve verified
Access, alerts and repainting behaviour have not been independently verified for this indicator. Check the creator’s current publication and settings.
General descriptions and classifications are recovered research. Verified details above identify the specific checks we have completed. Check the creator’s current publication for later changes.