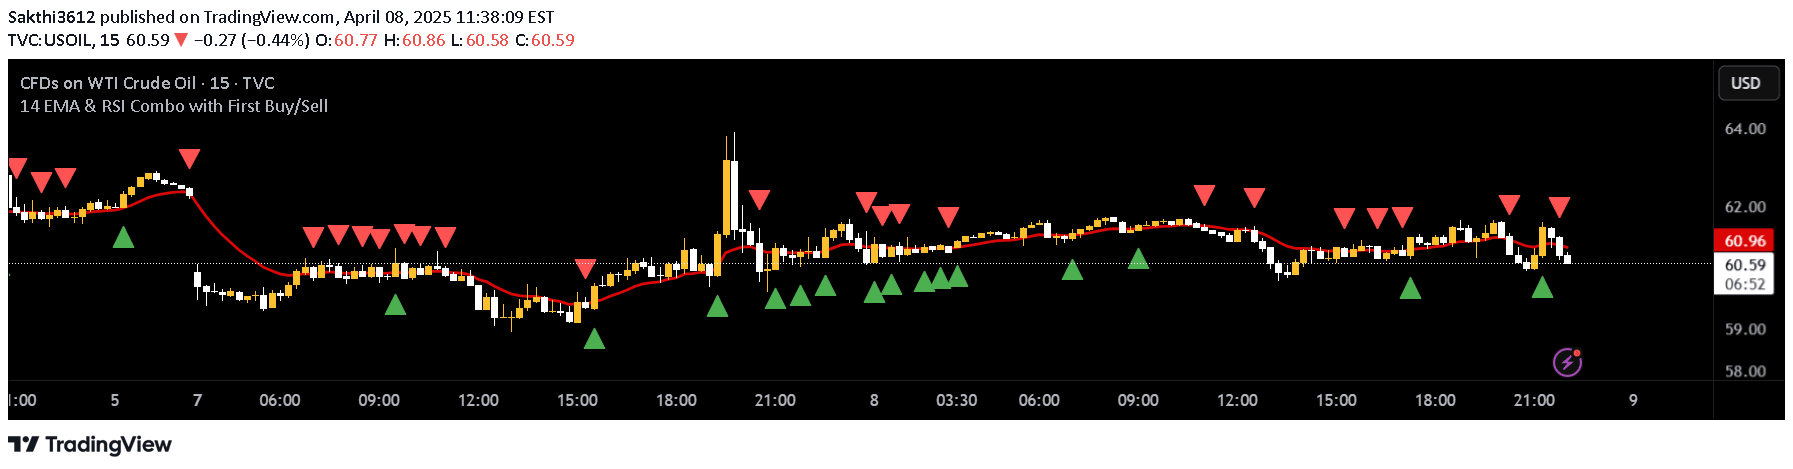
EMA14 and RSI strategy combines exponential moving average and relative strength index to generate trading signals by analyzing trend direction and momentum indicators.
Explore complementary indicator rolesHow it works
The EMA14 and RSI strategy integrates two powerful technical indicators to generate trading signals. The Exponential Moving Average (EMA) with a 14-period setting helps identify the short-term trend direction by smoothing price data and giving more weight to recent prices.
The Relative Strength Index (RSI) complements the EMA by measuring momentum and identifying potential overbought or oversold conditions. Traders analyze the crossover points between price and EMA, alongside RSI readings above 70 or below 30, to make informed entry and exit decisions.
Why it may be useful
This strategy provides traders with a comprehensive approach to market analysis by combining trend and momentum indicators. It helps identify potential trading opportunities by offering insights into both price direction and market sentiment.
By integrating EMA and RSI, traders can reduce the likelihood of false signals and improve their decision-making process. The strategy allows for more nuanced market interpretation, helping traders recognize potential trend reversals and momentum shifts more effectively.
When to explore it
The EMA14 and RSI strategy works best in markets with clear trending characteristics and moderate volatility. It is particularly effective in trending markets where price movements are more predictable and momentum indicators can provide reliable signals.
Traders should apply this strategy across different timeframes, focusing on higher timeframe trends for confirmation. It is most suitable for day and swing trading, where the combination of trend and momentum analysis can help identify potential entry and exit points with greater precision.
Keep exploring
What we’ve verified
Access, alerts and repainting behaviour have not been independently verified for this indicator. Check the creator’s current publication and settings.
General descriptions and classifications are recovered research. Verified details above identify the specific checks we have completed. Check the creator’s current publication for later changes.