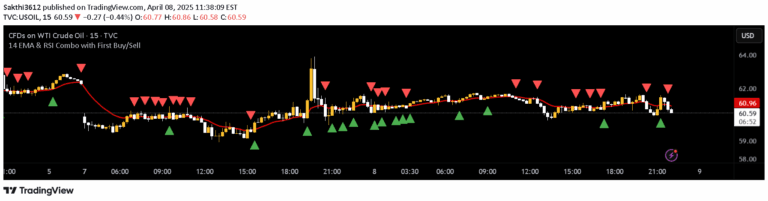
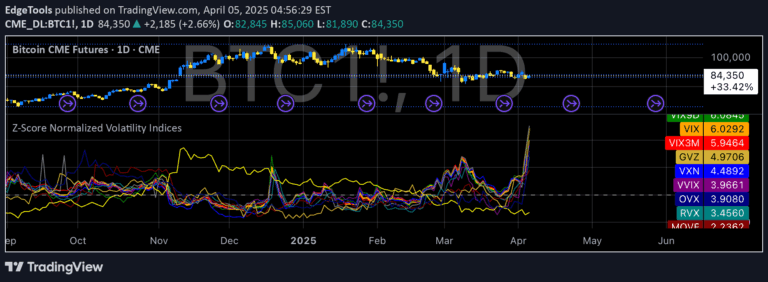
NET BSP is a volatility indicator that tracks buying and selling pressure, helping traders understand market balance and potential trend movements by comparing bullish and bearish candle metrics.
Explore complementary indicator rolesHow it works
The NET Buying and Selling Pressure (NET BSP) indicator calculates the balance between buying and selling momentum by analyzing green and red candle metrics separately. It derives a net value by subtracting selling pressure from buying pressure, creating a dynamic representation of market sentiment.
When the NET BSP is above zero, it indicates bullish momentum, and when it's below zero, it suggests bearish momentum. The indicator also tracks changes in these values, providing visual cues through color-coded signals that represent different stages of market trends and potential wave movements.
Why it may be useful
The NET BSP helps traders gain a more intuitive understanding of market dynamics by providing a clear visual representation of buying and selling pressures. It allows traders to quickly assess the strength and direction of market trends, making it easier to identify potential entry and exit points.
By offering insights into the balance between bullish and bearish forces, this indicator enables traders to make more informed decisions about market movements and potential trend reversals. Its ability to show how one wave derives from another provides valuable context for understanding market behavior.
When to explore it
The NET BSP is most effective when used across different timeframes, with the ability to adjust its sensitivity to match specific trading strategies. It works particularly well in markets with clear trending characteristics, helping traders identify momentum shifts and potential trend continuations or reversals.
Traders can use this indicator in conjunction with other technical analysis tools to confirm signals and improve overall trading decision-making. It is especially useful for identifying early signs of trend changes and understanding the underlying market sentiment across various financial instruments and timeframes.
Keep exploring
What we’ve verified
Access, alerts and repainting behaviour have not been independently verified for this indicator. Check the creator’s current publication and settings.
General descriptions and classifications are recovered research. Verified details above identify the specific checks we have completed. Check the creator’s current publication for later changes.