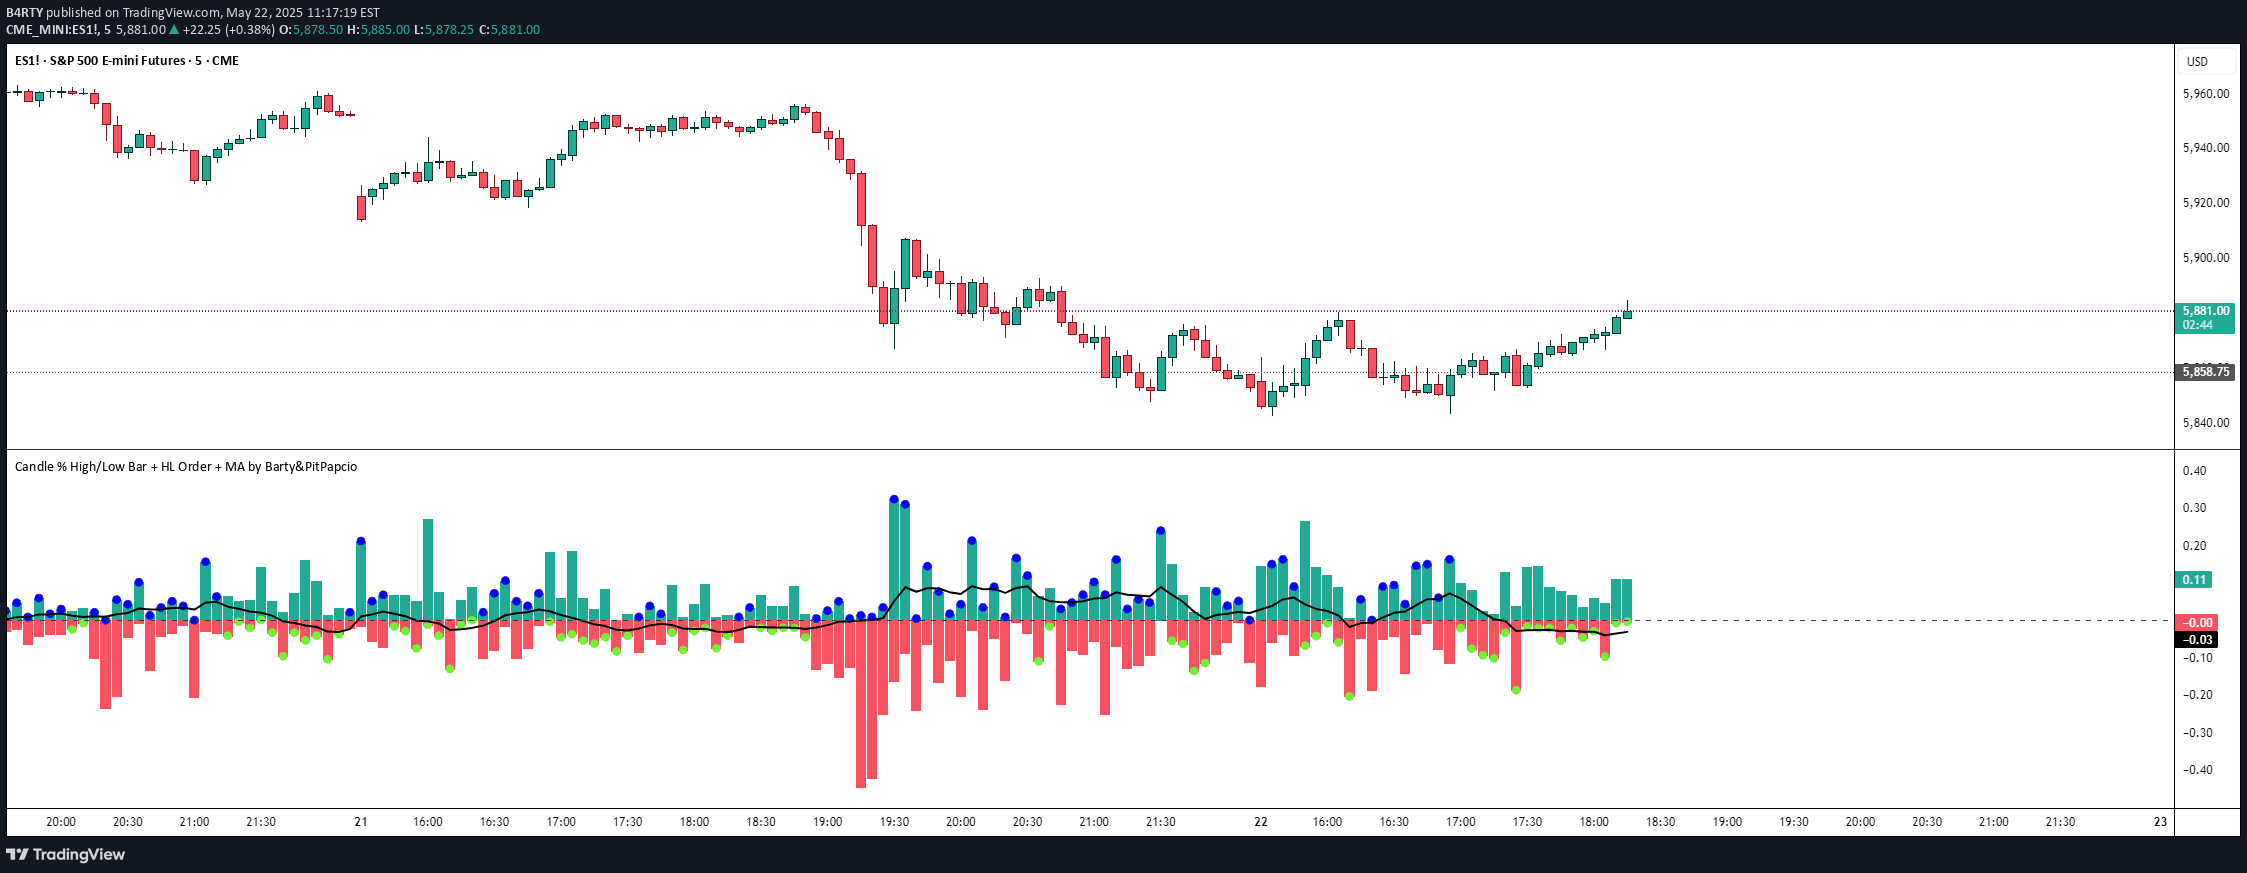
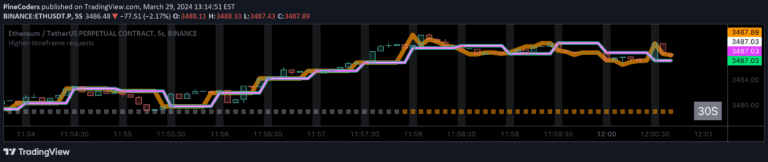
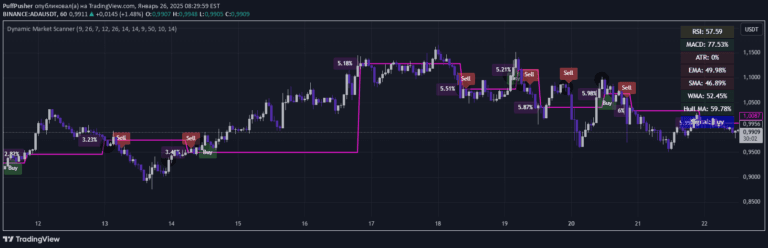
A comprehensive multi-timeframe analysis tool using high-timeframe candles, DMI, RSI, and moving averages to provide detailed market insights across different time periods.
Explore complementary indicator rolesHow it works
The HighLowBox+220MAs signal integrates multiple technical analysis tools across different timeframes to provide a comprehensive market view. It uses libHTF library to calculate higher timeframe candles internally, generating visualizations for current and four higher timeframes ranging from 5 minutes to monthly charts.
The system generates detailed visual representations including HTF candles, DMI arrows, Fibonacci levels, and high-low range boxes. It also calculates and displays RSI signals and moving averages (20 and 200 SMA/EMA) across multiple timeframes, offering traders a multi-dimensional perspective of market dynamics.
Why it may be useful
This signal provides traders with a holistic view of market trends by integrating multiple technical indicators across different timeframes. By displaying candles, trend indicators, RSI signals, and moving averages simultaneously, traders can make more informed decisions based on comprehensive market analysis.
The multi-timeframe approach helps traders identify potential trend changes, momentum shifts, and key support/resistance levels. The color-coded RSI signals and extensive visualization tools enable quick interpretation of market conditions, reducing the complexity of technical analysis and providing clearer trading insights.
When to explore it
This signal is most effective when traders want a comprehensive market overview across multiple timeframes, from short-term scalping to longer-term swing trading. It works best in markets with clear trending behavior and when seeking to confirm trend strength and potential reversals using multiple technical indicators.
Traders can utilize this tool during periods of market transitions, when looking to validate potential entry or exit points, and when needing a detailed understanding of price dynamics across different time horizons. It is particularly useful for developing a nuanced trading strategy that considers both immediate and broader market contexts.
Keep exploring
What we’ve verified
Access, alerts and repainting behaviour have not been independently verified for this indicator. Check the creator’s current publication and settings.
General descriptions and classifications are recovered research. Verified details above identify the specific checks we have completed. Check the creator’s current publication for later changes.