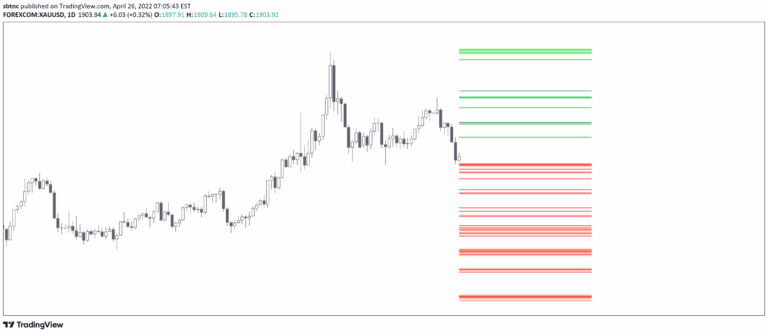
Liquidity Pools
A liquidity indicator that identifies potential market order zones by mapping swing highs and lows, revealing where stop-loss orders and significant liquidity pools are likely positioned.
Explore 11,183 indicators. Filter beyond the obvious.
Discover the tools that fit the way you trade.
11,183 tools to explore
A liquidity indicator that identifies potential market order zones by mapping swing highs and lows, revealing where stop-loss orders and significant liquidity pools are likely positioned.
A trading indicator that identifies untapped liquidity levels across different timeframes, helping traders understand potential price movement magnets and liquidity pools in the market.
A technical indicator that highlights previous day's high and low points, uses daily and weekly separators to create a clean chart that helps traders understand potential market direction.
A trading indicator that highlights previous market highs and lows, creating customizable support and resistance zones across multiple timeframes to help traders identify potential price reaction levels.
A specialized price tracking indicator displaying previous day, week, and month's high and low price levels, adaptable across different timeframes to help traders identify key historical price reference points.
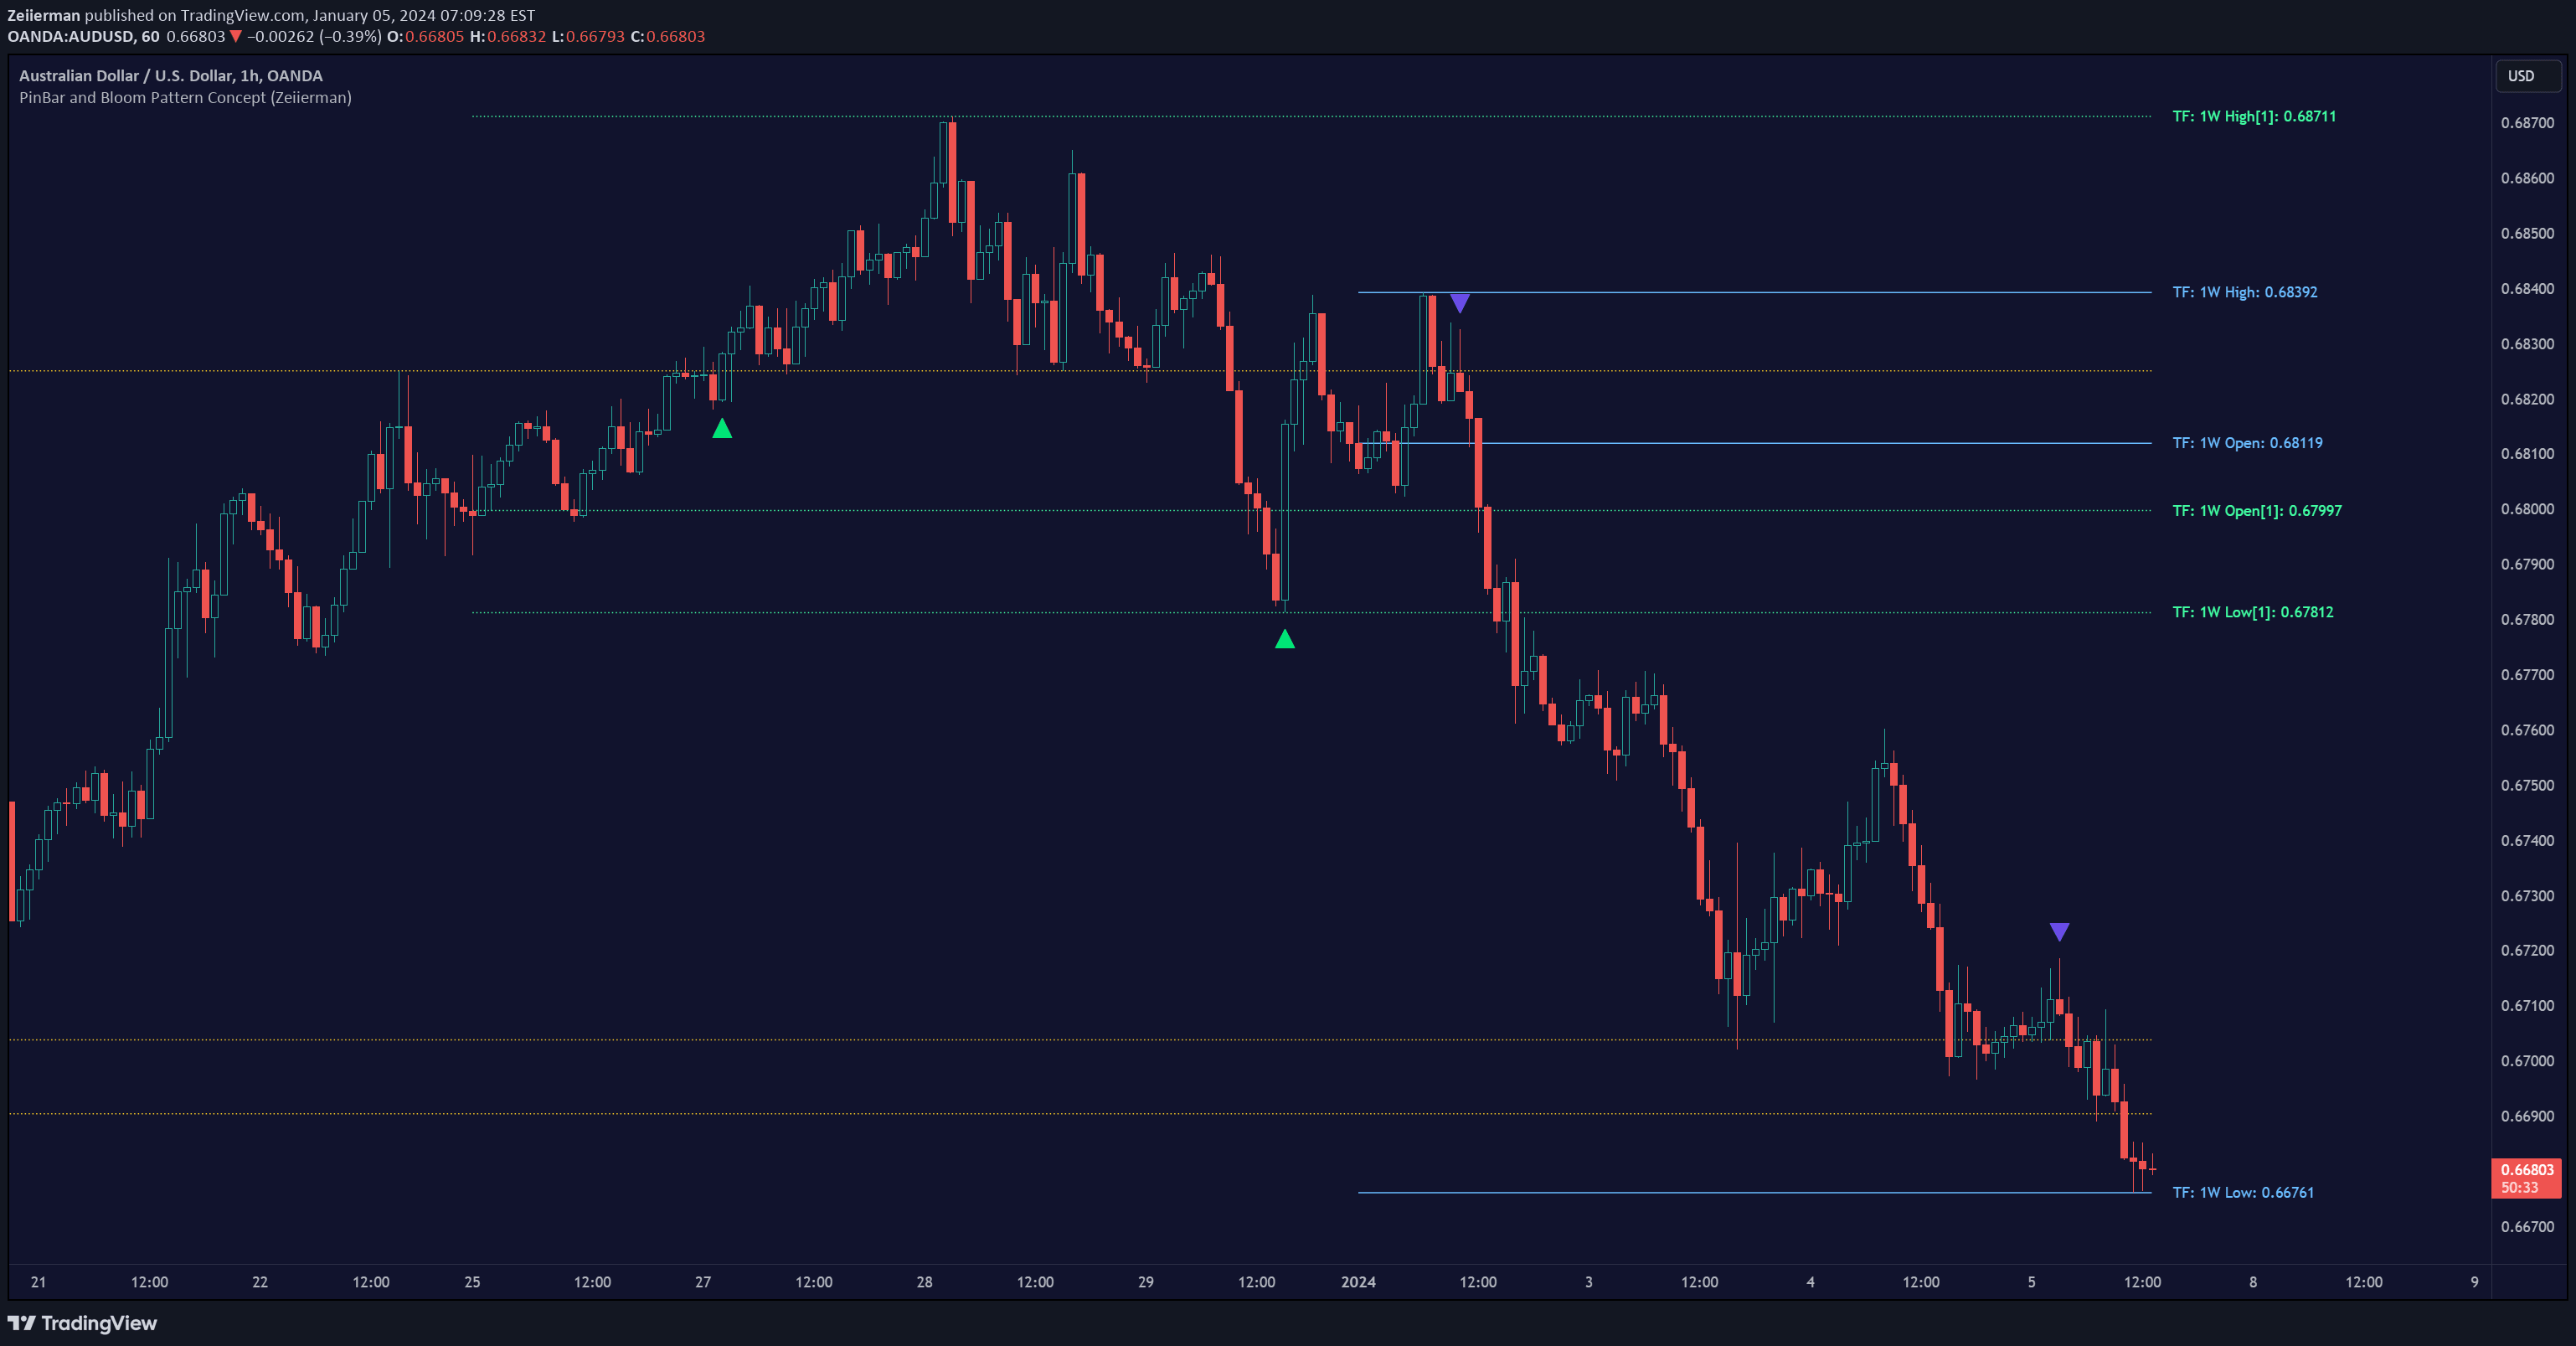
A trading strategy analyzing candlestick patterns using symmetry, baseline bound, and specific pattern recognition to identify potential market trend reversals and continuations.
A multi-ticker dashboard that visually tracks swing structures across different timeframes, helping traders identify potential trend formations and market confluence.
A trading signal that identifies potential market reversals by analyzing price symmetry, baseline boundaries, and precision pin bar formations for precise entry and exit points.
A pivot point profile indicator that groups and displays data from previous swing highs and lows, helping traders identify potential support and resistance zones.
An advanced support and resistance indicator that dynamically identifies key price levels using multi-timeframe analysis and volume confirmation, with automatic role reversal capabilities.
A highly configurable indicator that tracks previous key price levels across multiple timeframes, allowing traders to identify important support, resistance, and liquidity zones with customizable settings.
A multi-functional trading indicator that visualizes high timeframe liquidity levels, identifies market structure breaks, and highlights price displacements for advanced trading strategies.
Likes, views, and comments are historical TradingView snapshots. They describe attention, not trading performance.