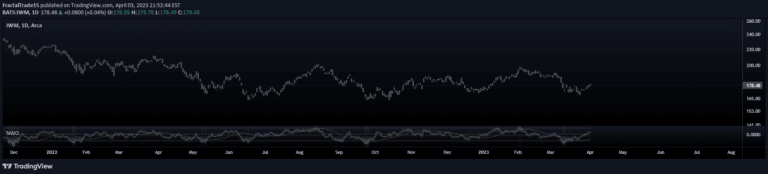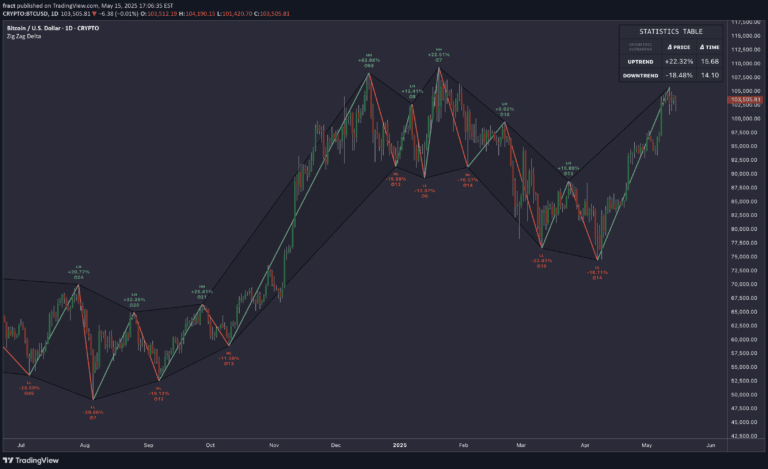
Zig Zag Trend Metrics
A sophisticated trend analysis tool that automatically detects market swing points, visualizes trend dynamics, and provides real-time statistical insights into price movements and trend characteristics.
Explore 11,183 indicators. Filter beyond the obvious.
Discover the tools that fit the way you trade.
11,183 tools to explore
A sophisticated trend analysis tool that automatically detects market swing points, visualizes trend dynamics, and provides real-time statistical insights into price movements and trend characteristics.
An advanced trading indicator using the Average Directional Index to evaluate trend strength and direction, providing dynamic visual insights into market momentum and potential trading opportunities.
The Nadaraya-Watson Oscillator is an advanced kernel-based indicator that measures price momentum and potential trend changes by comparing price to dynamic bands.
A fractal-based indicator that identifies multi-scale price turning points by processing market fluctuations and revealing nested cycle dynamics across different timeframes.
A volume-based indicator that plots the delta between buy and sell volumes, providing visual insight into dominant market volume and potential trend divergences.
A custom trading indicator that allows users to set multiple price lines and vertical time markers to identify critical price levels and time clusters for strategic entry points.
A trading strategy focusing on hourly candle opens, revealing market maker movements through accumulation, manipulation, and distribution phases.
A multi-scale geometric visualization tool that maps market structure through pivot points, revealing underlying price action architecture across different time frames.
NET BSP is a volatility indicator that tracks buying and selling pressure, helping traders understand market balance and potential trend movements by comparing bullish and bearish candle metrics.
An Anchored Moving Average is a dynamic indicator that allows traders to calculate moving averages from selected points, providing flexible trend analysis and visual slope representation.
Body/Range is a volatility indicator that measures the percentage of a candle's body relative to its total range, revealing the confidence and health of price movement.
A comprehensive indicator tracking multiple time-based liquidity levels and price points across different trading sessions, helping traders identify potential market entry and exit points.
Likes, views, and comments are historical TradingView snapshots. They describe attention, not trading performance.