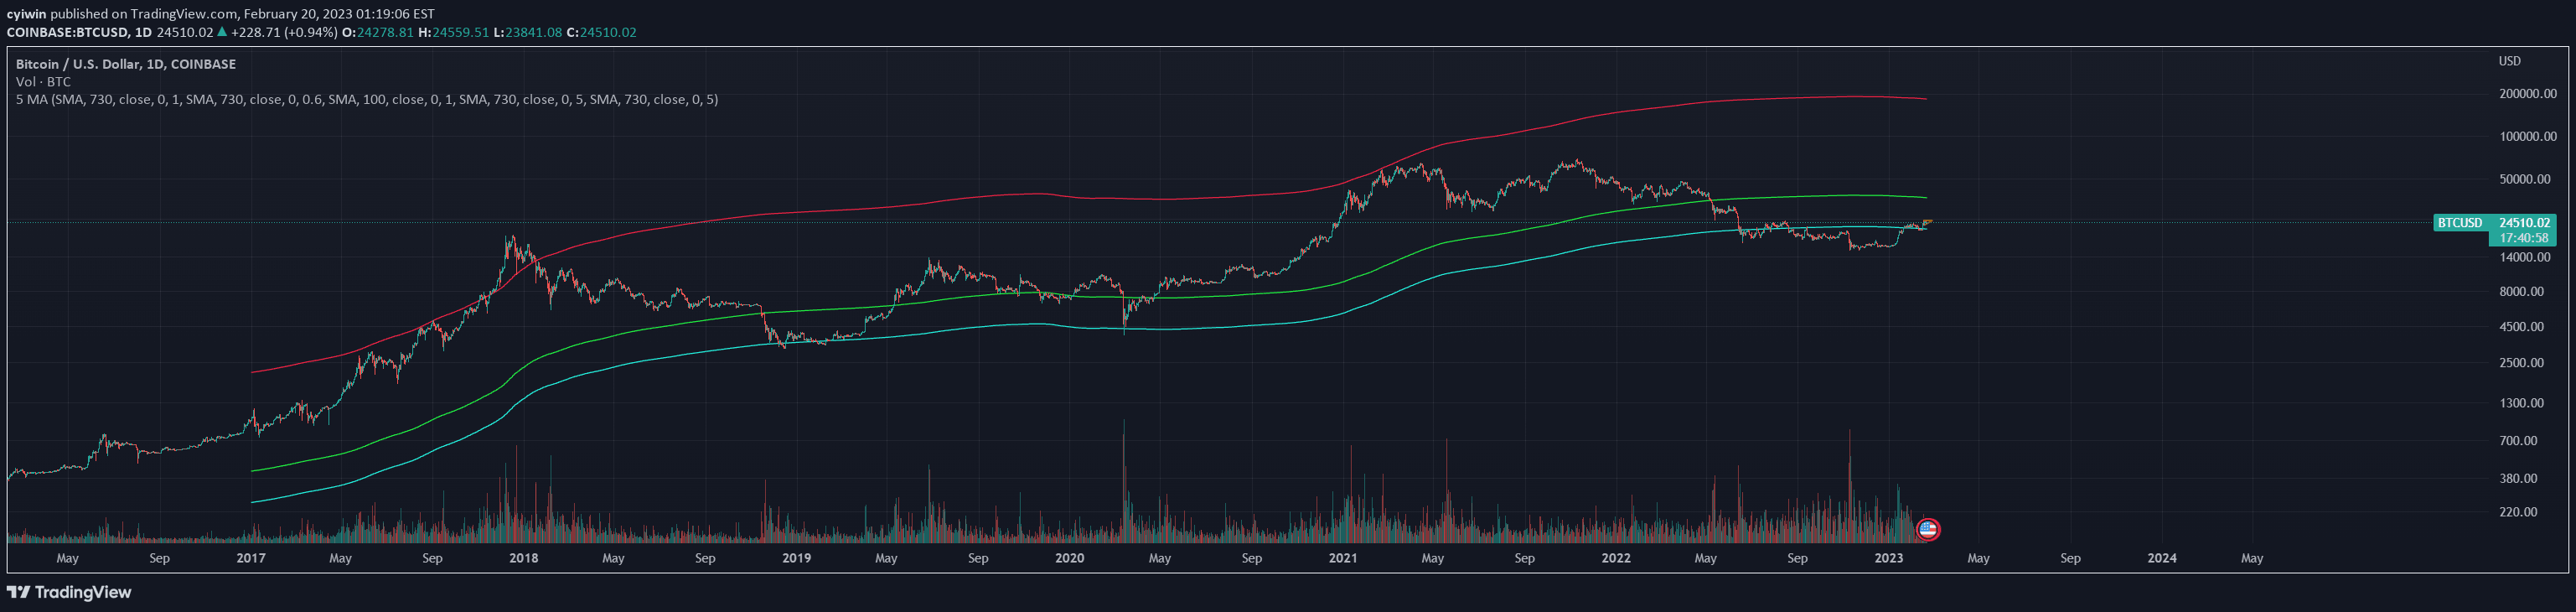
An Anchored Moving Average is a dynamic indicator that allows traders to calculate moving averages from selected points, providing flexible trend analysis and visual slope representation.
Explore complementary indicator rolesHow it works
An Anchored Moving Average (AMA) begins by allowing traders to select specific points on a chart from which to calculate a moving average. Unlike traditional moving averages with fixed calculation periods, the AMA uses a cumulative and dynamic denominator that starts from the chosen anchor point. Traders can select up to three different points to plot separate moving averages, each representing a unique perspective on price movement.
The indicator calculates the average price from the selected anchor point, continuously updating as new price data becomes available. The moving average is colored based on its slope, using a gradient defined by user-selected colors, which provides a visual representation of trend direction and momentum.
Why it may be useful
The Anchored Moving Average offers traders enhanced flexibility in analyzing price trends by allowing them to focus on specific market periods of interest. By enabling custom anchor points, traders can isolate and examine price movements during particular market conditions or significant events. This approach provides more nuanced insights compared to traditional fixed-period moving averages.
The color-coded slope visualization helps traders quickly interpret trend strength and direction, making it easier to identify potential trend changes or momentum shifts. By allowing customization of the price source and anchor points, the AMA can adapt to various trading styles and market contexts, providing a more personalized analytical tool.
When to explore it
The Anchored Moving Average is particularly useful during market transitions, allowing traders to analyze trend changes from key historical points like major price reversals or significant news events. Traders can use this indicator to identify trend strength, momentum, and potential trend continuation or reversal patterns by selecting anchor points at critical market turning points.
This indicator works best in markets with clear trend structures and when traders want to focus on specific time frames or market segments. It is especially valuable for analyzing historical price behavior, comparing different market periods, and developing more targeted trading strategies that go beyond traditional fixed-period moving average analysis.
Keep exploring
What we’ve verified
Access, alerts and repainting behaviour have not been independently verified for this indicator. Check the creator’s current publication and settings.
General descriptions and classifications are recovered research. Verified details above identify the specific checks we have completed. Check the creator’s current publication for later changes.