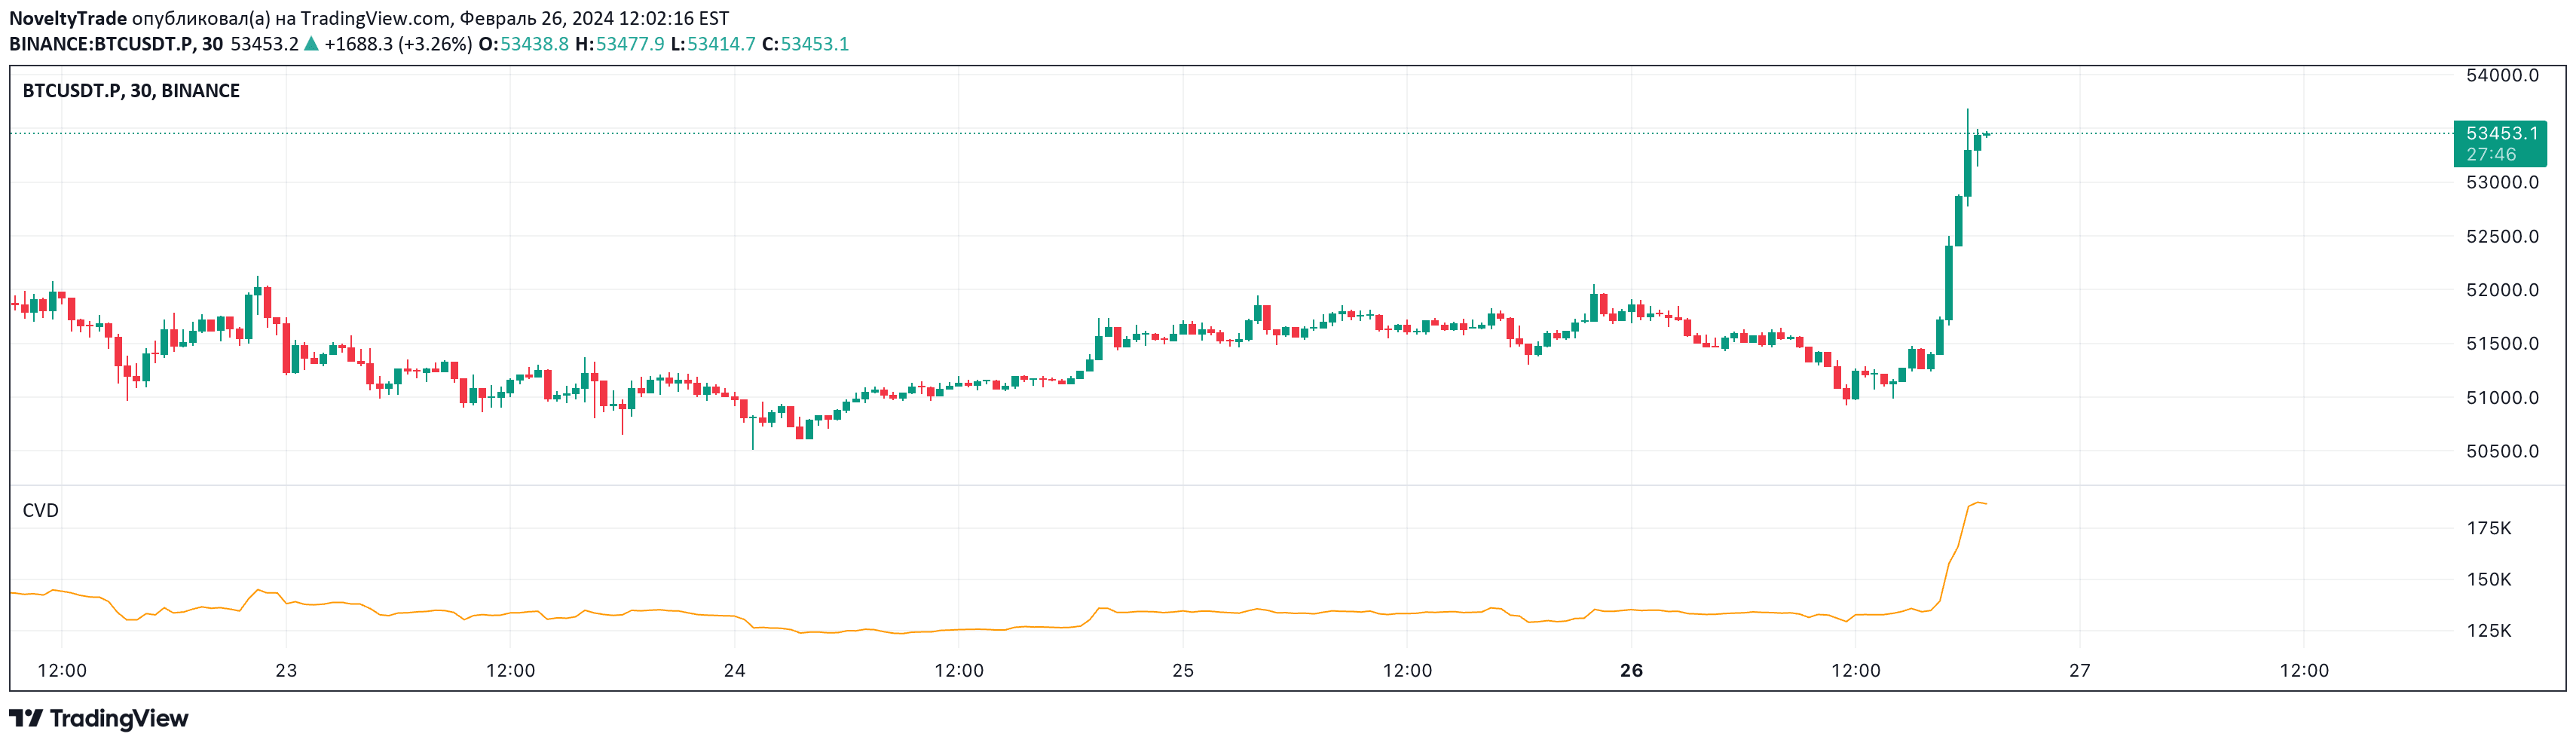
A volume-based indicator that plots the delta between buy and sell volumes, providing visual insight into dominant market volume and potential trend divergences.
Explore complementary indicator rolesHow it works
The indicator calculates the difference between buy and sell volumes, creating a delta representation in column format. It uses lower timeframe volume data, with a default setting of 1-minute intervals and the potential for custom lower timeframe settings for more precise analysis.
By plotting the volume delta above traditional up/down volume columns, traders can visually interpret the balance of buying and selling pressure. The columns effectively highlight the net volume flow, making it easier to identify which side of the market is currently more dominant.
Why it may be useful
Volume delta provides critical insights into market sentiment and potential trend reversals by revealing the underlying buying and selling dynamics. It helps traders understand the strength of price movements beyond simple price action, offering a more nuanced view of market participation.
By highlighting imbalances between buy and sell volumes, traders can detect potential weakness or strength in current price trends. This information can be especially valuable for identifying potential trend exhaustion or the beginning of new market momentum.
When to explore it
The volume delta indicator is most effective during periods of active trading with significant volume, such as during market opens, major economic announcements, or when trading liquid instruments. It works best when combined with other technical analysis tools to confirm potential trade signals.
Traders should pay special attention to divergences between volume delta and price movement, as these can signal potential trend reversals or weakening momentum. It is particularly useful for short-term traders seeking to understand immediate market dynamics and volume-driven price actions.
Keep exploring
What we’ve verified
Access, alerts and repainting behaviour have not been independently verified for this indicator. Check the creator’s current publication and settings.
General descriptions and classifications are recovered research. Verified details above identify the specific checks we have completed. Check the creator’s current publication for later changes.