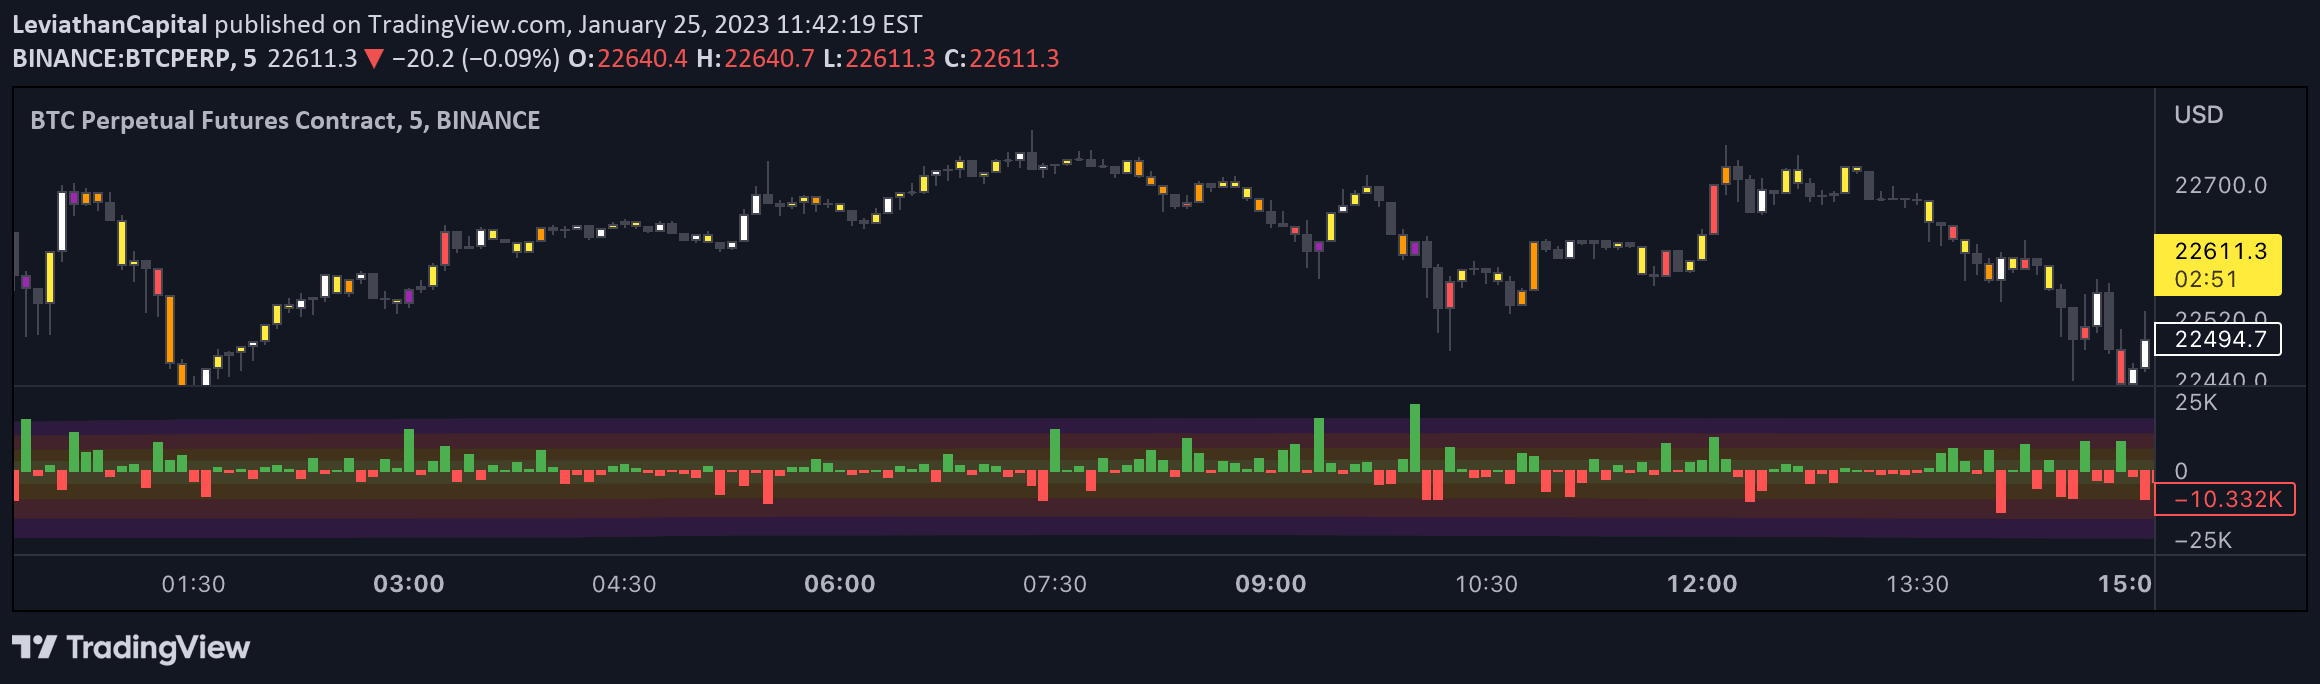
A net volume delta indicator tracking BTC spot pairs from 8 exchanges, aggregating volume data to provide insights into market sentiment and potential price movements.
Explore complementary indicator rolesHow it works
The indicator calculates the aggregated net volume delta by collecting volume data from eight major cryptocurrency exchanges trading BTC spot pairs. It analyzes the net difference between buying and selling volumes across these exchanges, creating a comprehensive view of market activity.
By aggregating data from multiple exchanges, the indicator provides a more robust and holistic perspective on market sentiment. It tracks the net volume across different trading platforms, helping traders understand the underlying buying and selling pressure in the Bitcoin market.
Why it may be useful
This volume-based indicator offers traders critical insights into market dynamics by revealing the strength of buying or selling pressure across multiple exchanges. It helps traders understand the underlying sentiment and potential momentum in the Bitcoin market, which can be particularly valuable during volatile trading conditions.
By providing a consolidated view of volume data, the indicator allows traders to make more informed decisions about market trends and potential price movements. It can serve as a confirmation tool for other technical analysis methods, enhancing overall trading strategy and risk management.
When to explore it
The indicator is most effective when used in conjunction with other technical analysis tools, particularly during periods of significant market movement or potential liquidation events. It can be especially useful on higher timeframes where long-term market sentiment becomes more apparent.
Traders should pay close attention to the oscillator's color and trend, using it as a confirmation signal for potential market bias. When the oscillator is green or trending upward, it suggests a positive market sentiment, while a downward trend indicates potential bearish conditions.
Keep exploring
What we’ve verified
Access, alerts and repainting behaviour have not been independently verified for this indicator. Check the creator’s current publication and settings.
General descriptions and classifications are recovered research. Verified details above identify the specific checks we have completed. Check the creator’s current publication for later changes.