Funding Rate [CryptoSea]
A comprehensive funding rate indicator analyzing cryptocurrency markets across multiple exchanges, tracking price dynamics in perpetual futures and spot markets to reveal market sentiment.
Explore 11,183 indicators. Filter beyond the obvious.
Discover the tools that fit the way you trade.
11,183 tools to explore
A comprehensive funding rate indicator analyzing cryptocurrency markets across multiple exchanges, tracking price dynamics in perpetual futures and spot markets to reveal market sentiment.
Advanced MACD indicator offering comprehensive customization with 20 entry conditions for both long and short trades. Provides flexible signal generation for precise trading strategy implementation.
A multi-symbol divergence screener that monitors up to 24 trading symbols simultaneously, identifying potential trading signals across different indicators and timeframes.
Rainbow Drift Beta is an EMA-based indicator that detects trend direction and potential entry points by analyzing multiple exponential moving averages across different timeframes.
A trading signal that compares Bitcoin prices between Coinbase and Binance, revealing price premiums or discounts by tracking price differences across exchanges.
A crypto trading strategy using pullback candles, volume analysis, and multiple candle patterns to identify trend entry points across different markets and timeframes.
A dual Simple Moving Average (SMA) system that identifies market regimes by tracking price movements relative to 50 and 200 SMAs, providing color-coded trend visualization and key metrics.
A net volume delta indicator tracking BTC spot pairs from 8 exchanges, aggregating volume data to provide insights into market sentiment and potential price movements.
ADX Forecast revolutionizes trend analysis by using linear regression to predict future ADX movements, providing traders with advanced insights into trend strength and potential market direction.
Fibonacci Retracement tool identifies potential support and resistance levels by applying Fibonacci ratios to price movements, helping traders analyze market trends and potential price reversals.
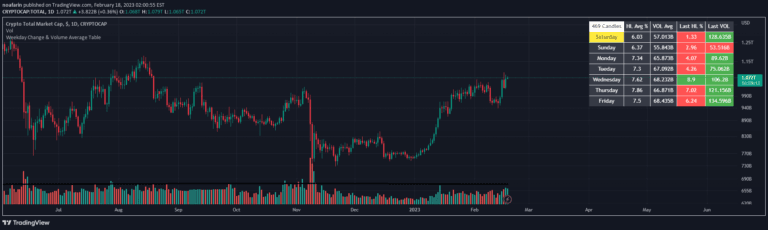
A script analyzing price movement and trading volume patterns across different weekdays, helping traders understand market behavior and potential trading opportunities.
A trading script that identifies market trends using EMA calculations, color-codes candlesticks, and highlights potential liquidity zones through dynamic pivot level tracking.
Likes, views, and comments are historical TradingView snapshots. They describe attention, not trading performance.