Ichimoku Cloud Momentum & Trend Indicator «NoaTrader»
An Ichimoku cloud-based indicator that visualizes trend changes and momentum strength through color-coded columns and a trend change diamond line.
Explore 11,183 indicators. Filter beyond the obvious.
Discover the tools that fit the way you trade.
11,183 tools to explore
An Ichimoku cloud-based indicator that visualizes trend changes and momentum strength through color-coded columns and a trend change diamond line.
A volume-based support and resistance indicator that dynamically identifies key price levels across different timeframes by analyzing trading volume and price action.
A multi-timeframe support and resistance indicator that identifies key price levels by analyzing candle highs, lows, and closes across different timeframes.
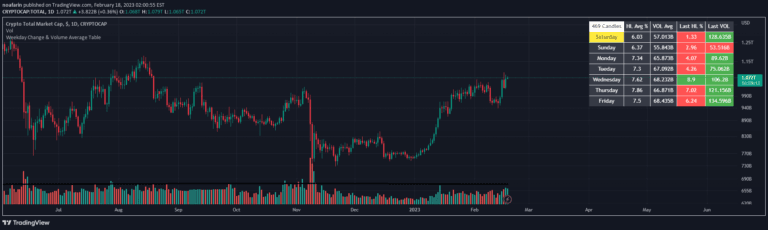
A script analyzing price movement and trading volume patterns across different weekdays, helping traders understand market behavior and potential trading opportunities.
A trading script that aggregates volume data from multiple major centralized cryptocurrency exchanges to provide a comprehensive view of trading activity for a specific trading symbol.
A script designed to analyze the historical market impact of US presidential elections by providing visualization of election and inauguration events.
A script for generating random trading candle data to explore market behavior, testing trading theories, and understanding market dynamics through computational simulation.
Likes, views, and comments are historical TradingView snapshots. They describe attention, not trading performance.