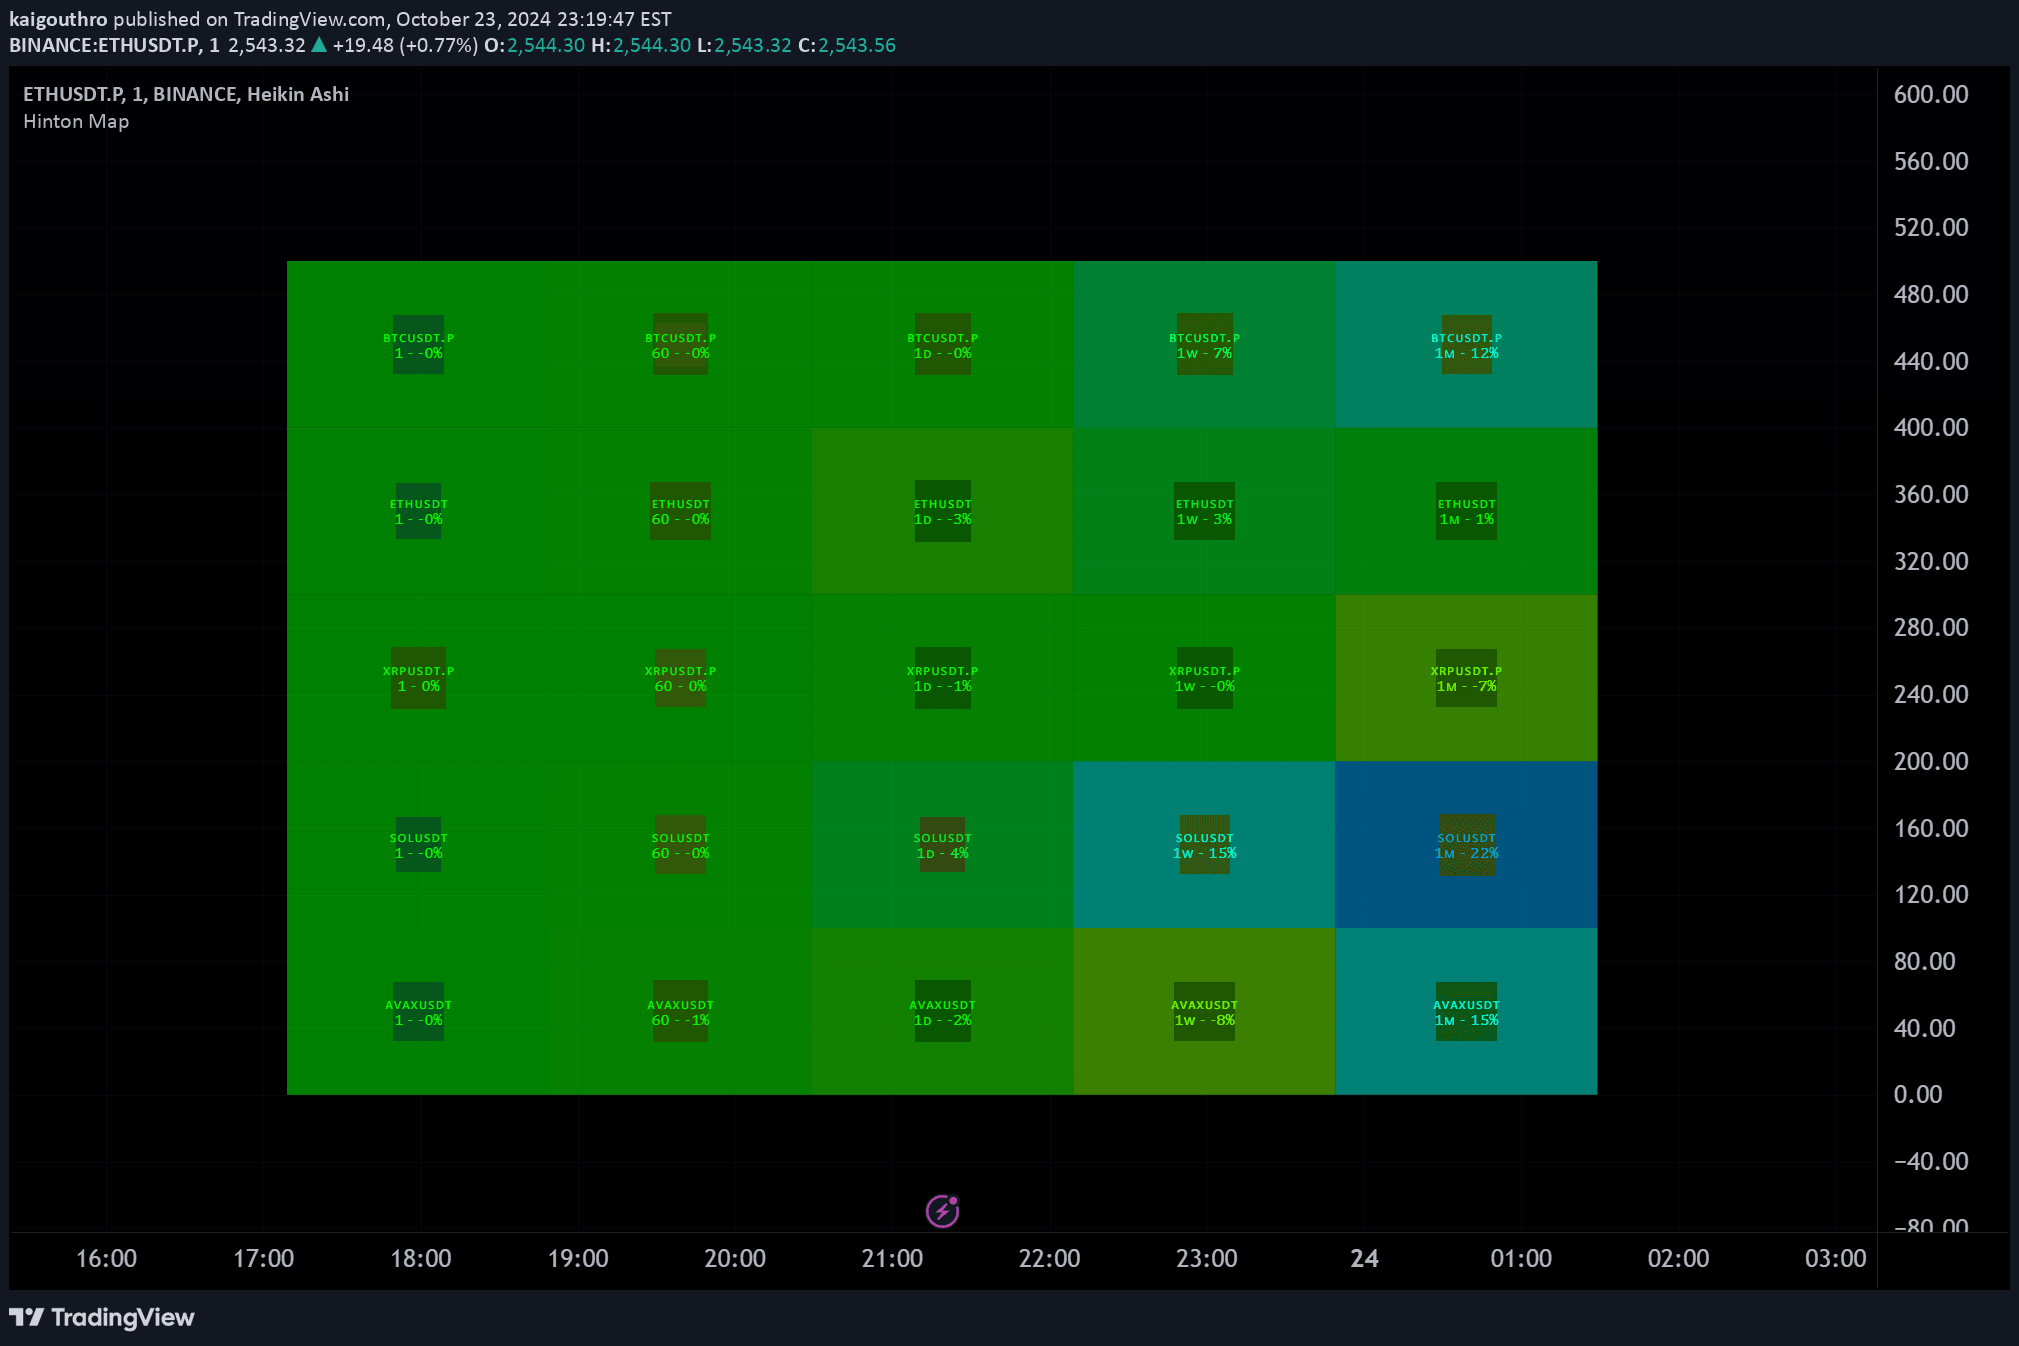
A script for generating random trading candle data to explore market behavior, testing trading theories, and understanding market dynamics through computational simulation.
Explore complementary indicator rolesHow it works
The script generates random candle data using computational methods to simulate market price movements. It creates artificial price charts that mimic potential trading scenarios, allowing for experimental analysis of market behavior.
By introducing controlled randomness, the script can produce price charts that test various trading hypotheses and explore potential market patterns. The randomization process involves generating price, volume, and candle characteristics to create a simulated trading environment.
Why it may be useful
Random data generation provides traders and researchers a tool to test trading theories and understand market dynamics without real financial risk. It helps identify potential flaws in trading strategies and explore how different market conditions might impact trading performance.
By comparing randomly generated charts with real market data, traders can gain insights into market complexity and the limitations of traditional trading theories. This approach allows for critical examination of trading assumptions and potential market behaviors.
When to explore it
This script is most useful during strategy development, hypothesis testing, and academic research into market behavior. It can be employed when traders want to explore trading theories without risking actual capital and need a controlled environment for simulation.
Researchers and quantitative traders can leverage this approach to validate trading concepts, understand market randomness, and develop more robust trading strategies. The script is particularly valuable when seeking to distinguish between genuine market patterns and random market noise.
Keep exploring
What we’ve verified
Access, alerts and repainting behaviour have not been independently verified for this indicator. Check the creator’s current publication and settings.
General descriptions and classifications are recovered research. Verified details above identify the specific checks we have completed. Check the creator’s current publication for later changes.