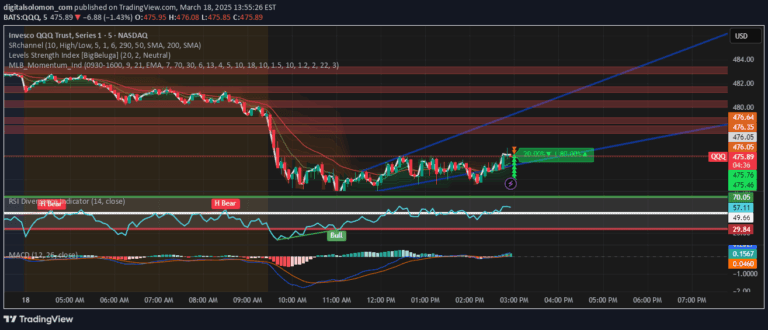
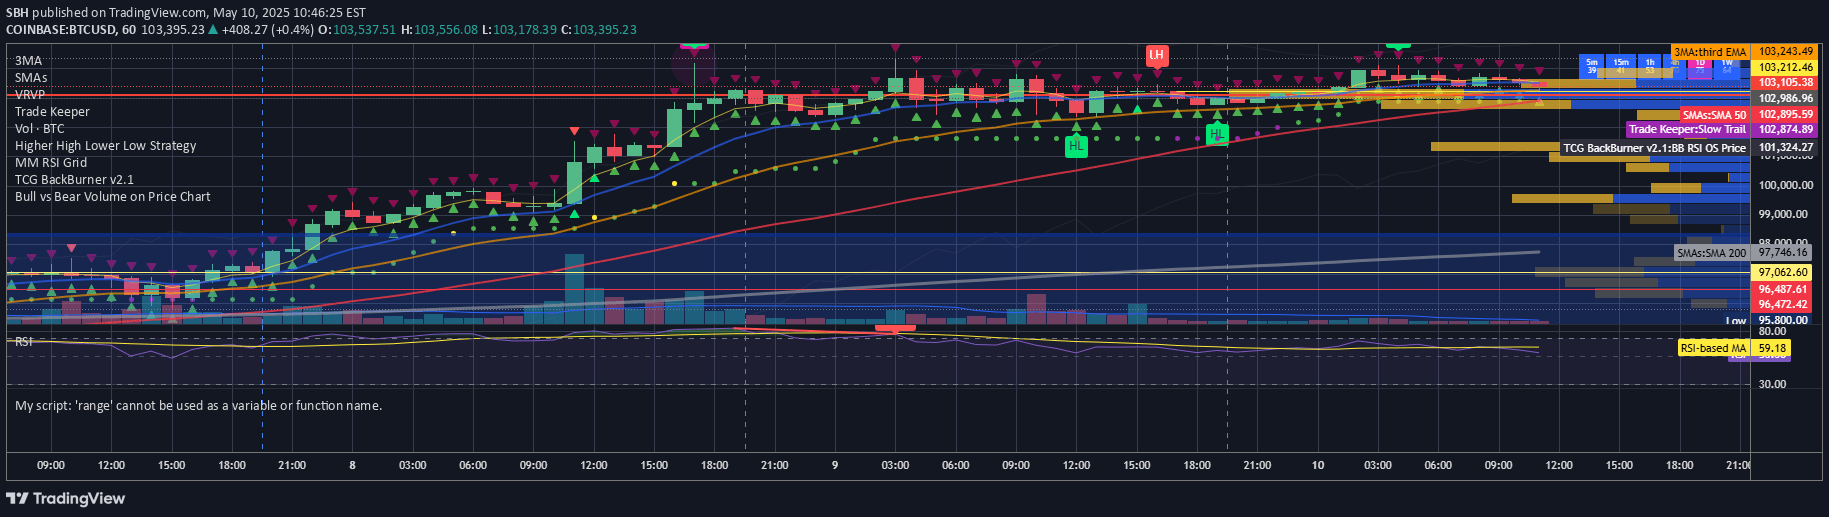
Candle body analysis reveals price momentum and trader sentiment by comparing open and close prices, indicating bullish or bearish market conditions.
Explore complementary indicator rolesHow it works
Candle body analysis examines the relationship between a bar's open and close prices to determine market direction and momentum. When the close price is higher than the open price, it creates a bullish candle, signaling positive market sentiment and potential upward movement.
Conversely, when the close price is lower than the open price, a bearish candle forms, indicating negative market sentiment and potential downward movement. The size of the candle body provides insights into the strength of buying or selling pressure, with larger bodies suggesting more significant trader interest and momentum.
Why it may be useful
Candle body analysis helps traders understand market psychology and potential price movements by revealing the balance of power between buyers and sellers. By interpreting candle colors and body sizes, traders can gain insights into market sentiment and potential trend reversals or continuations.
This analysis provides valuable information about market dynamics, allowing traders to make more informed decisions about entry and exit points. Understanding candle body characteristics can help traders identify momentum, support and resistance levels, and potential trading opportunities across different timeframes.
When to explore it
Candle body analysis is most effective during periods of market volatility and when looking to identify potential trend changes or momentum shifts. Traders can use this technique to assess market sentiment and make trading decisions across various financial instruments and timeframes.
The method is particularly useful when analyzing support and resistance levels, observing price action at key market zones, and determining the strength of buying or selling pressure. Traders can apply candle body analysis in day trading, swing trading, and scalping to enhance their understanding of market dynamics and improve trade decision-making.
Keep exploring
What we’ve verified
Access, alerts and repainting behaviour have not been independently verified for this indicator. Check the creator’s current publication and settings.
General descriptions and classifications are recovered research. Verified details above identify the specific checks we have completed. Check the creator’s current publication for later changes.