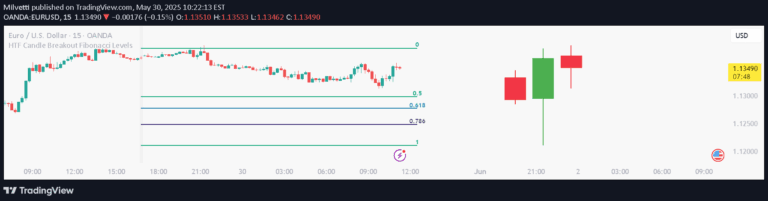
Fibonacci Retracement tool identifies potential support and resistance levels by applying Fibonacci ratios to price movements, helping traders analyze market trends and potential price reversals.
Explore complementary indicator rolesHow it works
The Fibonacci Retracement tool works by measuring the distance between significant swing highs and lows in a price movement. It applies key Fibonacci ratios like 0.236, 0.382, and 0.618 to create potential support and resistance levels on the chart.
Traders can choose between Linear Levels, which divide the price range into equal parts, and Logarithmic Price and Time Levels, which create proportionally equal segments. The tool also includes Fibonacci fans, which project potential price levels using trendlines based on Fibonacci ratios, providing additional insights into potential market movements.
Why it may be useful
Fibonacci Retracement is crucial for traders because it provides a mathematical approach to identifying potential market turning points and support/resistance levels. By using scientifically derived ratios, traders can make more informed decisions about entry and exit points, reducing emotional trading.
The tool's versatility allows it to be applied across various markets, including cryptocurrencies, stocks, and indices. Its ability to work with both linear and logarithmic levels makes it particularly powerful for analyzing volatile markets and detecting potential trend reversals or continuation patterns.
When to explore it
Fibonacci Retracement is most effective in markets with clear trend movements and significant price swings. It works particularly well in volatile markets like cryptocurrencies, where price movements can be dramatic and unpredictable. Traders should use this tool when analyzing assets with distinct swing highs and lows.
The indicator is especially useful during trending markets, whether bullish or bearish, and can help identify potential retracement levels before a trend continues. It's particularly valuable for traders looking to confirm potential entry and exit points, especially in high-volume markets like BTCUSDT, FETUSDT, and major stock indices.
Keep exploring
What we’ve verified
Access, alerts and repainting behaviour have not been independently verified for this indicator. Check the creator’s current publication and settings.
General descriptions and classifications are recovered research. Verified details above identify the specific checks we have completed. Check the creator’s current publication for later changes.