YOUR INDICATOR RESEARCH STARTS HERE

Find the right indicator.
Understand what it does.

Explore 11,183 indicators. Filter beyond the obvious.
Discover the tools that fit the way you trade.

THE INDICATOR LIBRARY

Results for “LOGARITHMIC”

11,183 tools to explore

148 indicators matching your filters
Save search
TrendEditor’s pick

Adaptive Trend Finder (log)

by Julien_Eche

The Adaptive Trend Finder is an advanced trading indicator that autonomously detects trend channels using logarithmic scale regression, offering flexibility in long-term or short-term trend analysis.

Main price chart · unverifiedSwing Trading
Explore
11.8Klikes291.8Kviews195comments
Save
TrendMomentumEditor’s pick

Swing High/Low Anchored Spiral

by alexgrover

An innovative trading signal that fits an Archimedean spiral to price action, allowing traders to visualize price movement through a unique geometric representation with customizable parameters.

Main price chart · unverifiedSwing Trading
Explore
2.2Klikes97.8Kviews32comments
Save
LevelsTrend

Fibonacci Retracement MTF/LOG

by dg_factor

A Fibonacci Retracement tool that calculates potential support and resistance levels across multiple timeframes using both linear and logarithmic scales.

Main price chart · unverifiedScalping · Day Trading
Explore
1.7Klikes23.4Kviews24comments
Save
LevelsMomentumTrend

Bitcoin Rainbow Wave

by leoum

A comprehensive Bitcoin trading model that combines power law trend, rainbow chart, and halving cycle wave to provide insights into potential price movements and market cycles.

Main price chart · unverifiedSwing Trading
Explore
1.4Klikes29.5Kviews32comments
Save
TrendSignalLevels

BTC Valuation

by VanHe1sing

A Bitcoin valuation tool that assesses market value by comparing current price to moving averages and logarithmic trendlines, providing insights into potential trading opportunities.

Separate pane · unverifiedDay Trading · Swing Trading
Explore
1.3Klikes15Kviews9comments
Save
TrendSignalLevels

IU Pivot Zones + GMA

by Shivam_Mandrai

An advanced trading indicator that detects dynamic support and resistance zones using pivot points, geometric moving averages, and real-time price action analysis to help traders identify potential market movements.

Main price chart · unverifiedScalping · Day Trading
Explore
1.1Klikes10.6Kviews13comments
Save
TrendMomentumEditor’s pick

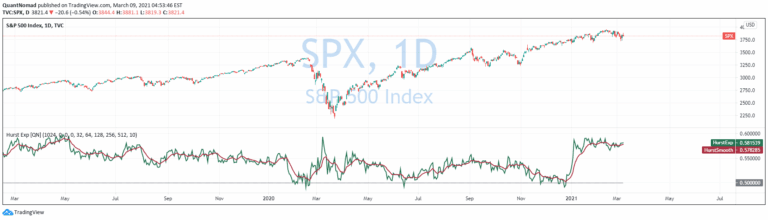
Hurst Exponent

by QuantNomad

The Hurst Exponent is a statistical measure that evaluates time series behavior, helping traders identify market trends, mean reversion, and potential future price movements.

Separate pane · unverifiedDay Trading · Swing Trading
Explore
861likes26.4Kviews10comments
Save

Likes, views, and comments are historical TradingView snapshots. They describe attention, not trading performance.

START WITH A QUESTION

A little less searching.
A lot more understanding.

Tell DeepAlpha what you need. Get an explanation, a shortlist,
and a direct path to the indicators behind it.

Ask DeepAlpha