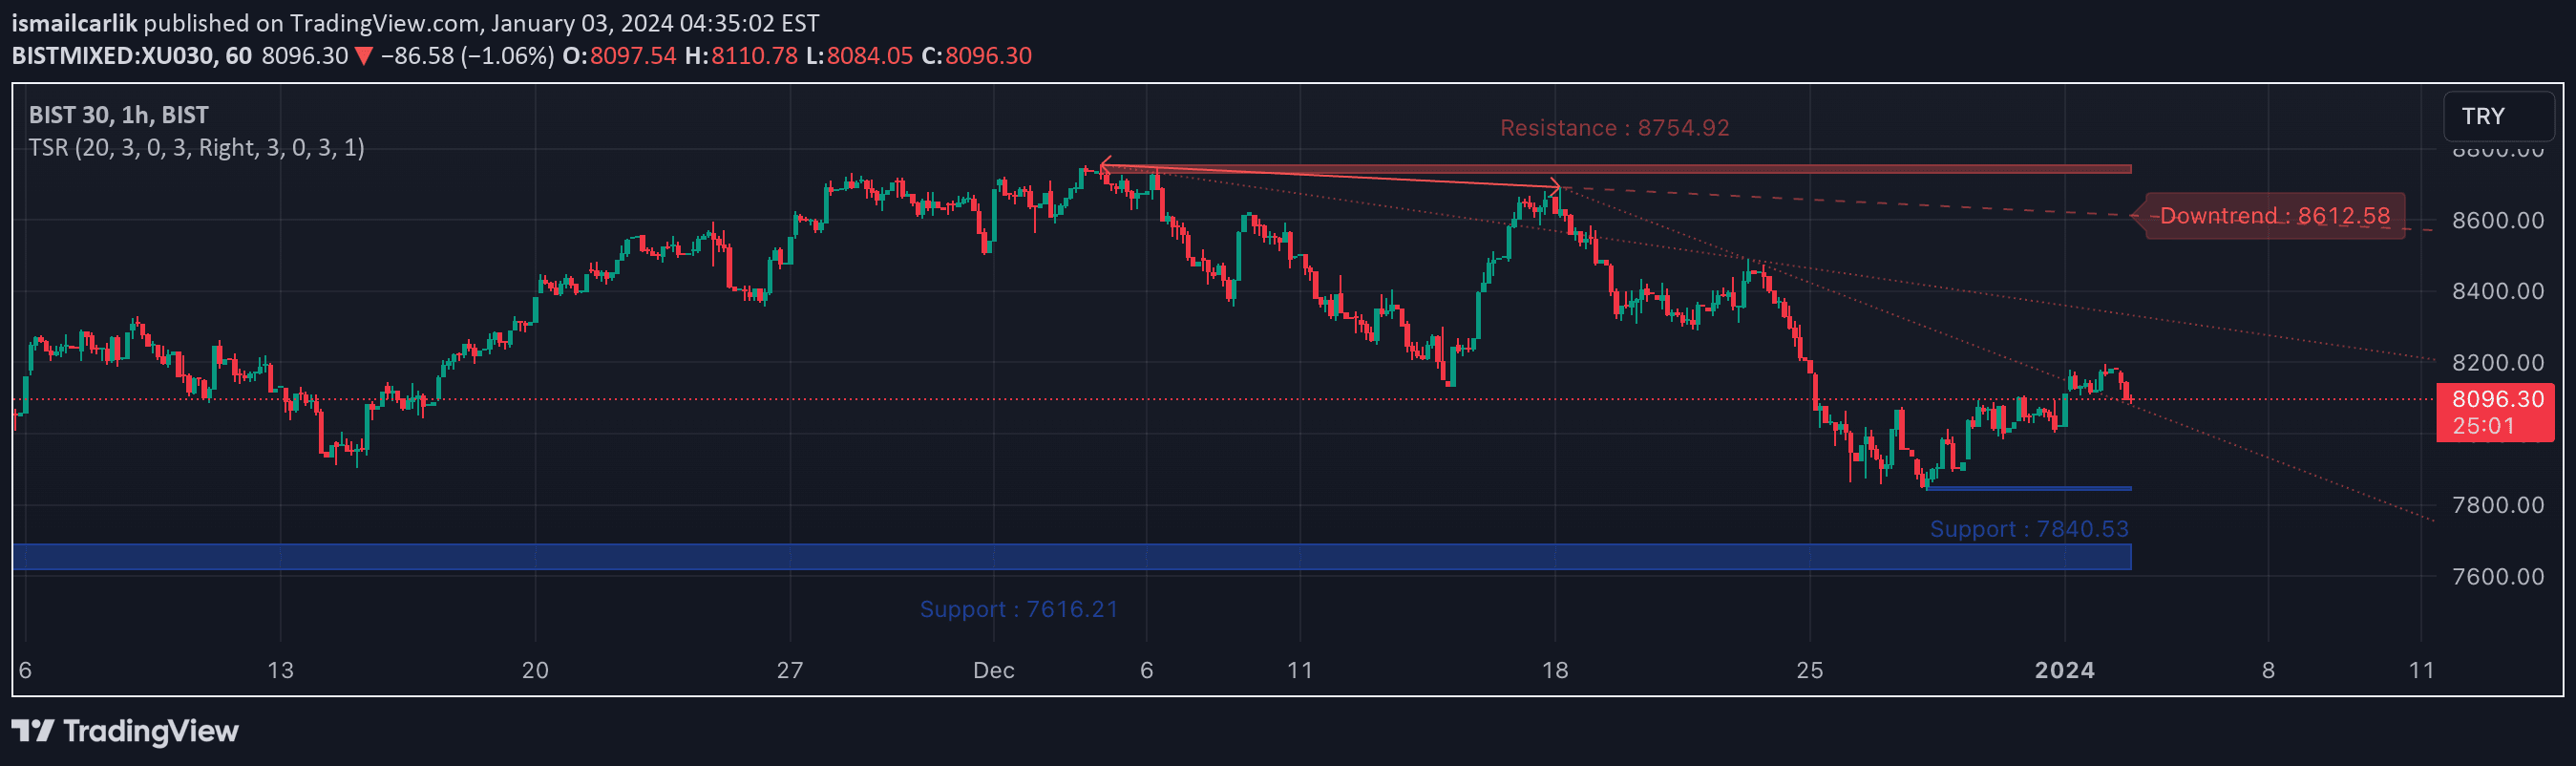
A technical analysis tool that identifies dynamic support and resistance levels by connecting past pivot high and low points, which can be applied to various indicators and chart types.
Explore complementary indicator rolesHow it works
The support and resistance indicator works by detecting pivot high and low points on a price chart using a configurable length parameter. It connects these pivot points to create linear support and resistance lines that can be extrapolated into the future.
Traders can customize the sensitivity by adjusting the length setting, with lower values detecting more frequent price variations and higher values focusing on longer-term trends. The indicator can also use custom input sources like moving averages or oscillators, providing flexibility in technical analysis
Why it may be useful
Support and resistance levels are crucial for traders because they help identify potential price reversal points and trading ranges. By understanding these key levels, traders can make more informed decisions about entry and exit points.
The indicator's ability to adapt to different chart types and indicators makes it a versatile tool for technical analysis. It provides a systematic approach to identifying potential market turning points and can help traders manage risk by highlighting important price levels
When to explore it
This indicator works best in markets with clear trending or ranging behaviors. It is particularly effective when price shows somewhat linear movement and predictable patterns. Traders should use this tool in conjunction with other technical indicators to confirm signals.
It is most reliable in timeframes that capture meaningful price swings, such as daily or weekly charts. Logarithmic scale can be applied for non-linear price evolutions to improve signal accuracy
Keep exploring
What we’ve verified
Access, alerts and repainting behaviour have not been independently verified for this indicator. Check the creator’s current publication and settings.
General descriptions and classifications are recovered research. Verified details above identify the specific checks we have completed. Check the creator’s current publication for later changes.