
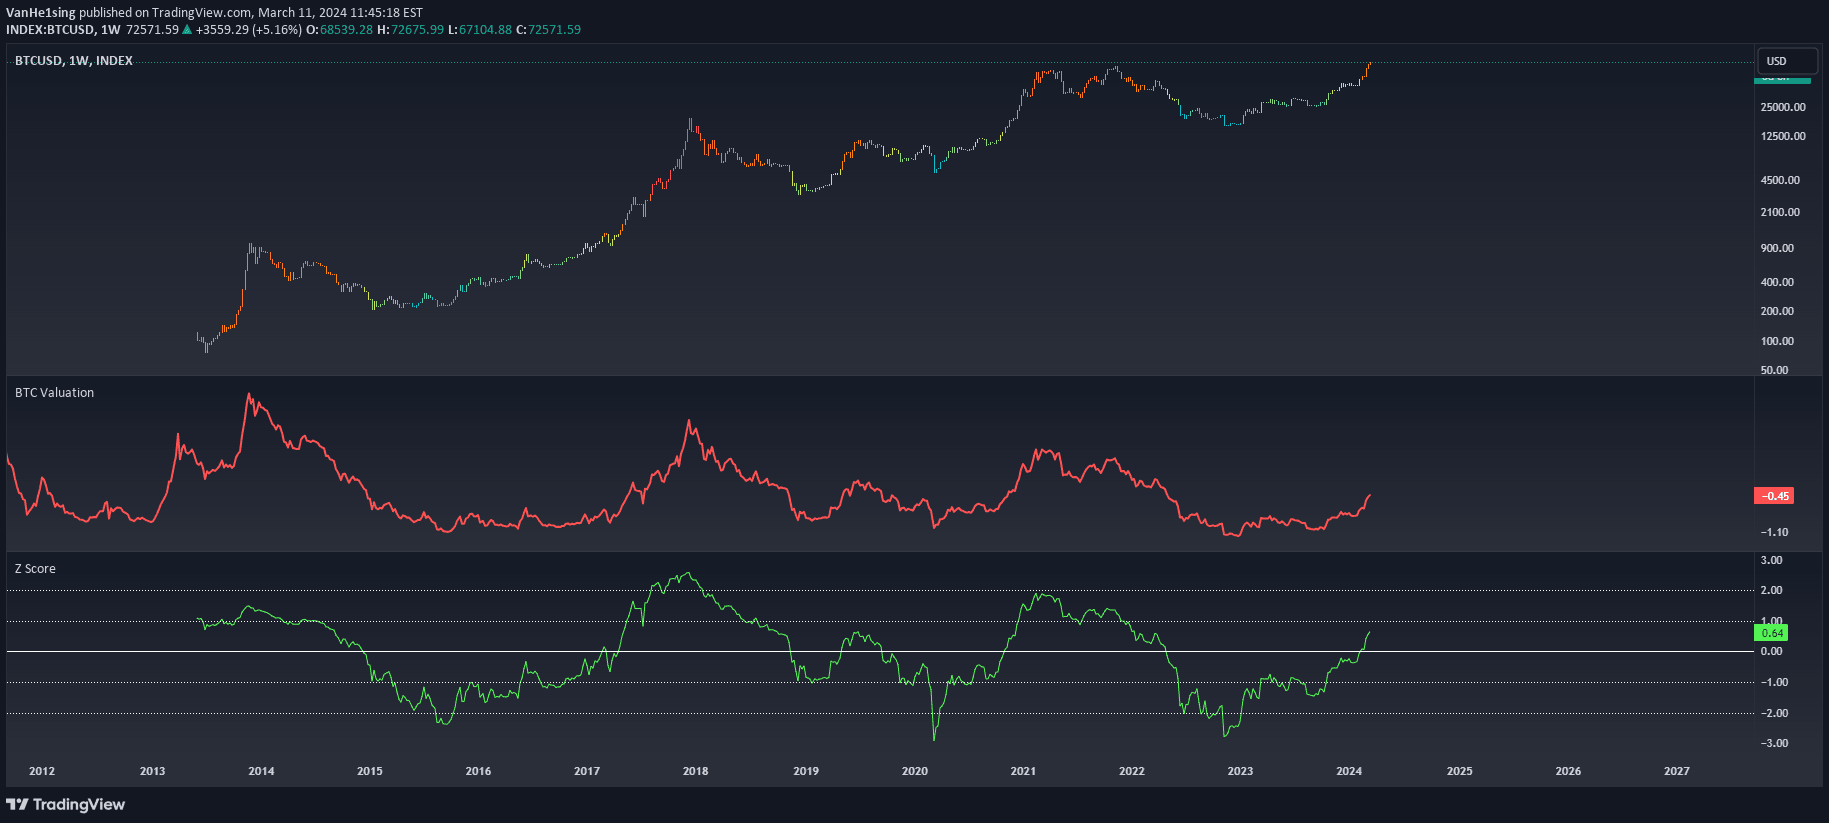
A Bitcoin valuation tool that assesses market value by comparing current price to moving averages and logarithmic trendlines, providing insights into potential trading opportunities.
Explore complementary indicator rolesHow it works
The BTC Valuation indicator operates by calculating multiple ratio metrics comparing Bitcoin's current price against key moving averages and a logarithmic trendline. It specifically examines the 200-day and 50-day Simple Moving Averages (SMA) in relation to the current price, generating ratio values that indicate potential market valuation states.
These ratios are then processed through a Z Score statistical method, which standardizes the measurements by calculating how far each ratio deviates from its historical mean. This approach transforms raw ratio data into a more interpretable statistical score, allowing traders to objectively assess Bitcoin's current market positioning relative to its historical price trends.
Why it may be useful
The BTC Valuation indicator provides traders with a comprehensive, multi-dimensional view of Bitcoin's market dynamics beyond simple price analysis. By integrating different time horizons and statistical scoring, it offers a nuanced perspective on potential market undervaluation or overvaluation, helping traders make more informed decisions.
Traditional price analysis often lacks depth, but this indicator bridges that gap by combining long-term and short-term trend perspectives. The Z Score integration adds an extra layer of statistical rigor, transforming raw price data into meaningful insights that can help traders identify potential entry and exit points with greater confidence.
When to explore it
The BTC Valuation indicator is most effective during periods of significant market movement or when Bitcoin is experiencing notable price fluctuations. Traders can leverage this tool during trending markets to confirm the strength and potential sustainability of price movements, helping to validate or challenge existing market sentiment.
It is particularly useful for traders seeking a more sophisticated approach to market analysis, offering insights that go beyond simple price charts. The indicator works best when combined with other technical and fundamental analysis tools, providing a complementary perspective that can help traders develop more robust trading strategies.
Keep exploring
What we’ve verified
Access, alerts and repainting behaviour have not been independently verified for this indicator. Check the creator’s current publication and settings.
General descriptions and classifications are recovered research. Verified details above identify the specific checks we have completed. Check the creator’s current publication for later changes.


