Statistical Trailing Stop [LuxAlgo]
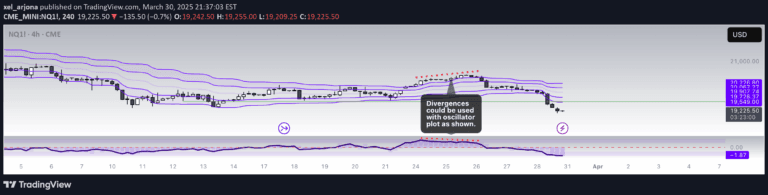
A statistical trailing stop tool that uses log-normal distribution of volatility to help traders lock in profits across different market conditions and trend strengths.
Explore 11,183 indicators. Filter beyond the obvious.
Discover the tools that fit the way you trade.
11,183 tools to explore
A statistical trailing stop tool that uses log-normal distribution of volatility to help traders lock in profits across different market conditions and trend strengths.
A trend reversal probability indicator that uses custom oscillator calculations to estimate market direction shifts and potential trend changes with statistical probability analysis.
A Bitcoin valuation tool that assesses market value by comparing current price to moving averages and logarithmic trendlines, providing insights into potential trading opportunities.
A statistical tool that uses z-scores and scatterplot visualization to analyze price momentum, detect trend shifts, and provide insights into market dynamics.
A predictive indicator that calculates the probability of moving average crossovers by analyzing potential future price movements and predicting MA interactions before they occur.
An advanced statistical indicator using volume-weighted Student-T distribution to dynamically track market volatility, providing adaptive tension bands and a normalized price oscillator.
A technical analysis tool using VWAP Z-Score to identify potential market reversals by measuring price deviation from the Volume Weighted Average Price using standard deviations.
A statistical indicator tracking the hourly likelihood of an asset's highest and lowest price points throughout the trading day, providing insights into price timing patterns.
A comprehensive COT report indicator displaying trader positioning and market sentiment across different trader categories, revealing potential market trend insights and trading pressures.
A script designed to detect optimal Supertrend parameters by systematically testing different factor and period combinations across various timeframes and market conditions.
A dynamic price leg analysis tool that calculates average leg heights and ranges, helping traders understand market structure and potential price movements across different time frames.
Bitcoin Monthly Seasonality indicator analyzes historical price performance across months, helping traders identify seasonal patterns and potential trading opportunities through monthly return analysis.
Likes, views, and comments are historical TradingView snapshots. They describe attention, not trading performance.