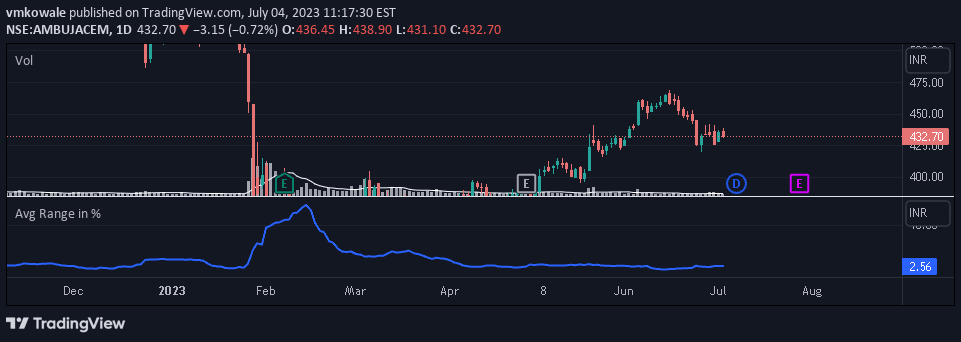
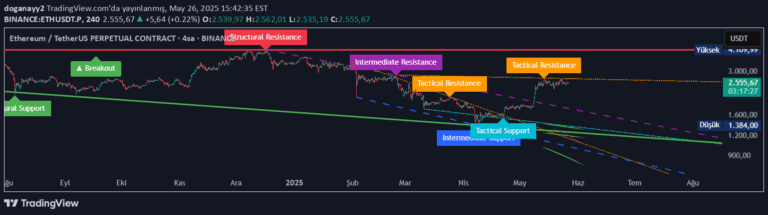
A dynamic price leg analysis tool that calculates average leg heights and ranges, helping traders understand market structure and potential price movements across different time frames.
Explore complementary indicator rolesHow it works
The indicator uses custom pivot point analysis to identify and measure price legs across different time frames, allowing traders to set a specific start time for analysis. By calculating leg heights for both large and small price movements, the tool breaks down market structure into measurable segments, tracking upward and downward price legs with user-configurable lookback and lookforward lengths.
Traders can toggle between different view options, including displaying statistics tables that show average leg heights for various categories. The indicator ensures that only multi-bar price legs are counted, filtering out single-bar movements to provide more meaningful market insights.
Why it may be useful
Understanding price leg dynamics helps traders gain deeper insights into market behavior and potential future movements by quantifying typical price ranges during specific market conditions. By providing a more nuanced view of price action than traditional volatility indicators, this tool allows traders to adapt their strategies to current market regimes.
The flexible design enables traders to customize analysis parameters, making it valuable across different trading styles and market environments. Detailed statistical breakdowns help traders develop a more systematic approach to understanding price movement characteristics.
When to explore it
This indicator is most effective during consolidating market periods where traders want to understand typical price ranges and market structure. It works particularly well when analyzing markets with consistent trading patterns, helping traders identify potential entry and exit points based on historical leg movements.
Traders can optimize the indicator by experimenting with different pivot lookback lengths to match current market volatility and trading conditions. It's especially useful for range-bound markets and when trying to develop a more statistical approach to understanding price action.
Keep exploring
What we’ve verified
Access, alerts and repainting behaviour have not been independently verified for this indicator. Check the creator’s current publication and settings.
General descriptions and classifications are recovered research. Verified details above identify the specific checks we have completed. Check the creator’s current publication for later changes.