Breakout Probability (Expo)
Breakout Probability indicator calculates the likelihood of new market highs or lows by analyzing historical price action and displaying percentage probabilities for potential price levels.
Explore 11,183 indicators. Filter beyond the obvious.
Discover the tools that fit the way you trade.
11,183 tools to explore
Breakout Probability indicator calculates the likelihood of new market highs or lows by analyzing historical price action and displaying percentage probabilities for potential price levels.
A Linear Regression Channel indicator that tracks price trends, identifies channel breakouts, and analyzes momentum direction using dynamic visual signals and customizable settings.
An advanced algorithmic indicator that automatically identifies and classifies complex chart patterns by analyzing trend lines, pivot points, and geometric formations across multiple timeframes.
The Adaptive Trend Finder is an advanced trading indicator that autonomously detects trend channels using logarithmic scale regression, offering flexibility in long-term or short-term trend analysis.
A comprehensive technical analysis tool that uses linear regression to plot channels, bands, and future price projections, helping traders identify trends, potential reversals, and market dynamics.
A volume heat map indicator that colors volume bars and candles based on the standard deviation of trading volume from its average. Provides visual insights into volume intensity and potential market significance.
An indicator that identifies divergences between swing points of a chart symbol and two external tickers, providing statistical insights into price behavior correlation.
A trading screener that identifies potential overbought or oversold market conditions across multiple symbols using a Mean Reversion Channel. Helps traders quickly scan assets for trading opportunities.
An advanced Open Interest indicator that provides comprehensive market insights through multiple visualization techniques and real-time statistical analysis of trading positions.
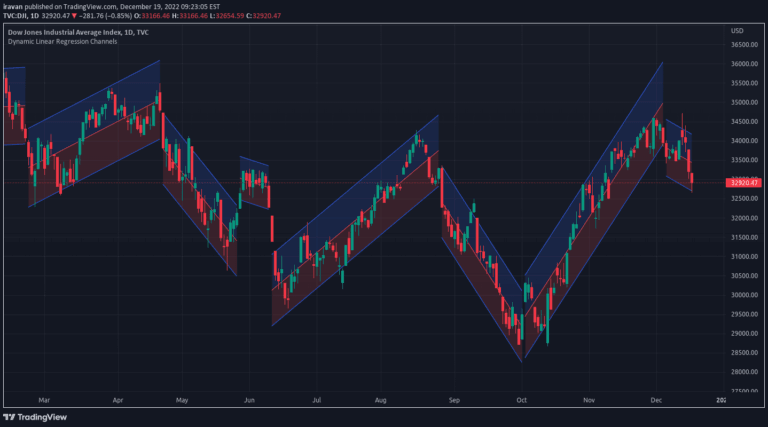
A dynamic linear regression channel indicator that adapts to price movements by creating new channels when previous channels break, helping traders identify trend changes and key price levels.
A tool that identifies potential price reversal zones using statistical probability by analyzing historical swing points and calculating precise percentile-based predictions.
A versatile trading indicator using kernel regression to smooth price data and reveal market trends through customizable regression lines and kernel types.
Likes, views, and comments are historical TradingView snapshots. They describe attention, not trading performance.