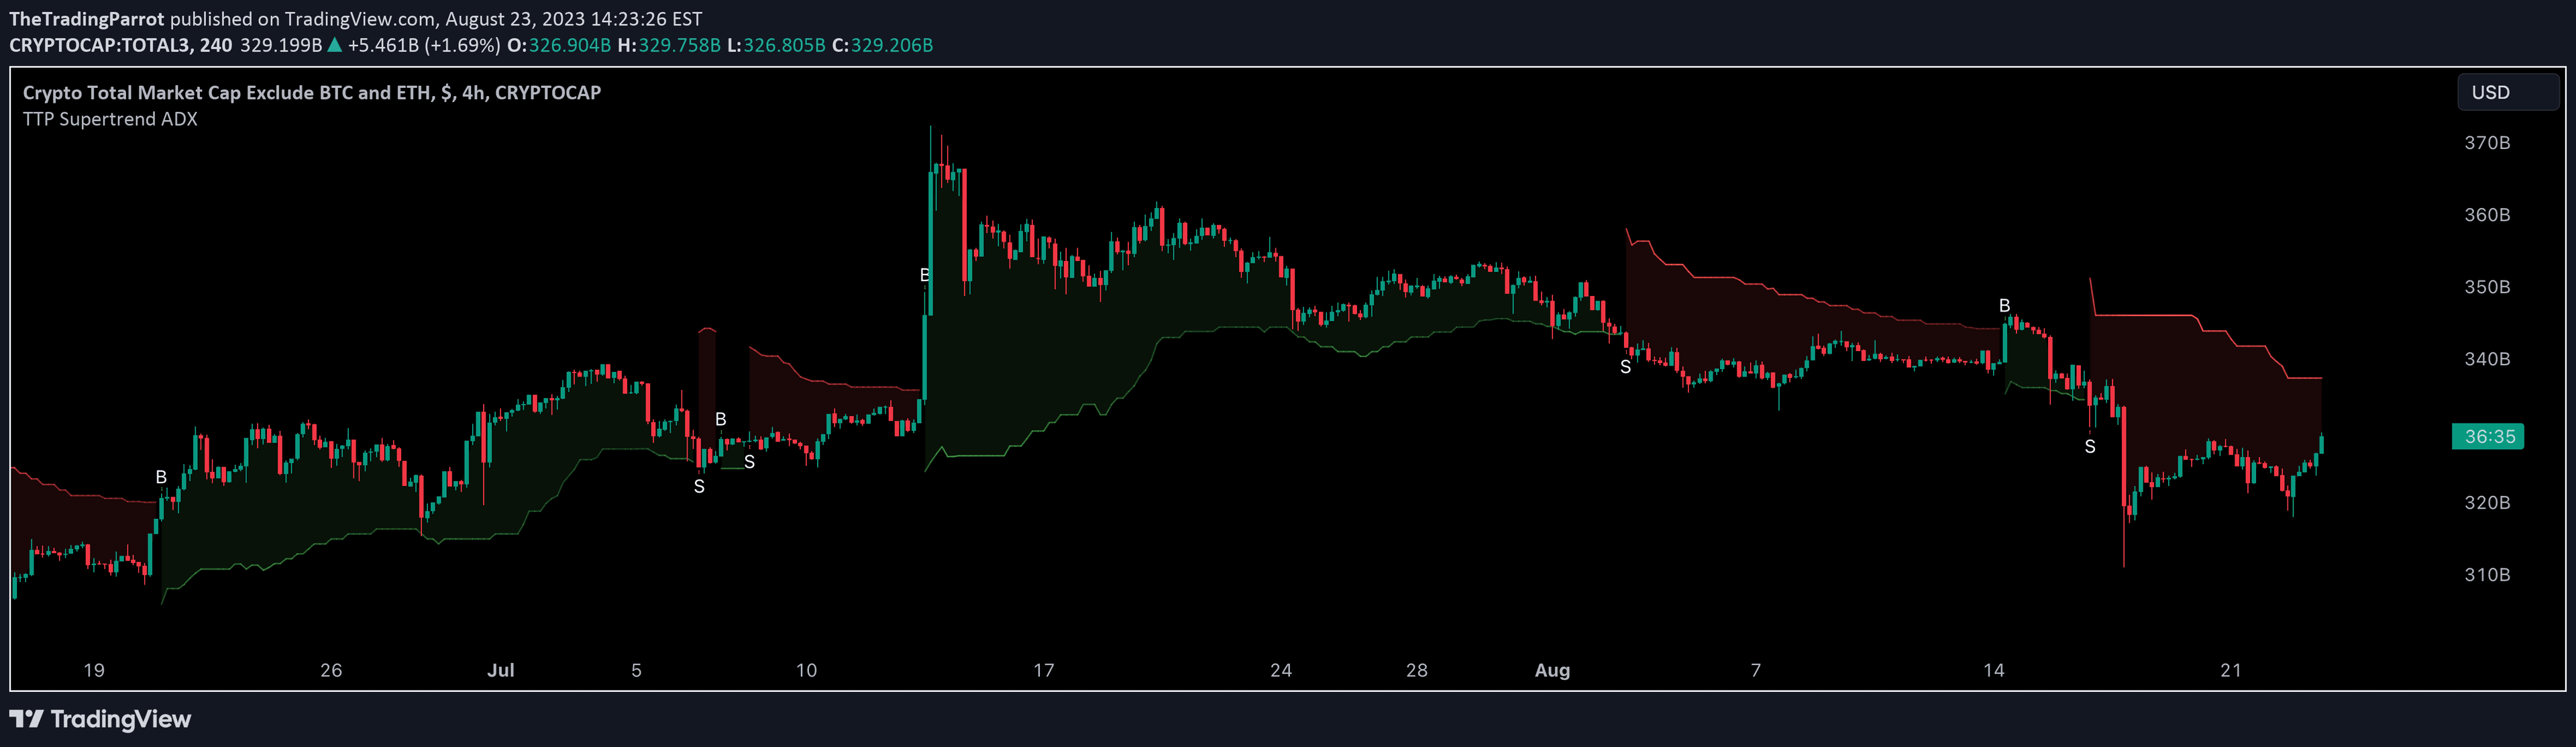
A script designed to detect optimal Supertrend parameters by systematically testing different factor and period combinations across various timeframes and market conditions.
Explore complementary indicator rolesHow it works
The script explores Supertrend parameter optimization by methodically testing different configurations across a predefined range. It incrementally adjusts the factor values from 3.0 to 12.0 with a 0.2 step increment, while simultaneously varying period values from 10 to 43 with a 3-unit increment.
By systematically evaluating these parameter combinations, the script aims to identify the most effective Supertrend settings for detecting market trends and potential trading signals. However, the comprehensive parameter testing process can be computationally intensive and may encounter performance limitations.
Why it may be useful
Parameter optimization is crucial for enhancing trading indicator performance and adapting to dynamic market conditions. By exploring multiple Supertrend configurations, traders can discover more precise and reliable trend detection settings that align with specific asset characteristics.
The script's approach demonstrates the importance of systematic strategy refinement, allowing traders to customize technical indicators for improved accuracy and potential trading efficiency. Understanding how different parameter combinations impact signal generation can lead to more informed and potentially more profitable trading decisions.
When to explore it
This optimization script is most beneficial when traders seek to fine-tune Supertrend parameters for specific financial instruments or market environments. It is particularly useful for traders who want to develop a more tailored and adaptive trend-following strategy.
The method is most effective when applied to assets with consistent volatility and clear trend characteristics. Traders should consider using this approach during periods of stable market conditions and when they have sufficient computational resources to perform comprehensive parameter testing.
Keep exploring
What we’ve verified
Access, alerts and repainting behaviour have not been independently verified for this indicator. Check the creator’s current publication and settings.
General descriptions and classifications are recovered research. Verified details above identify the specific checks we have completed. Check the creator’s current publication for later changes.