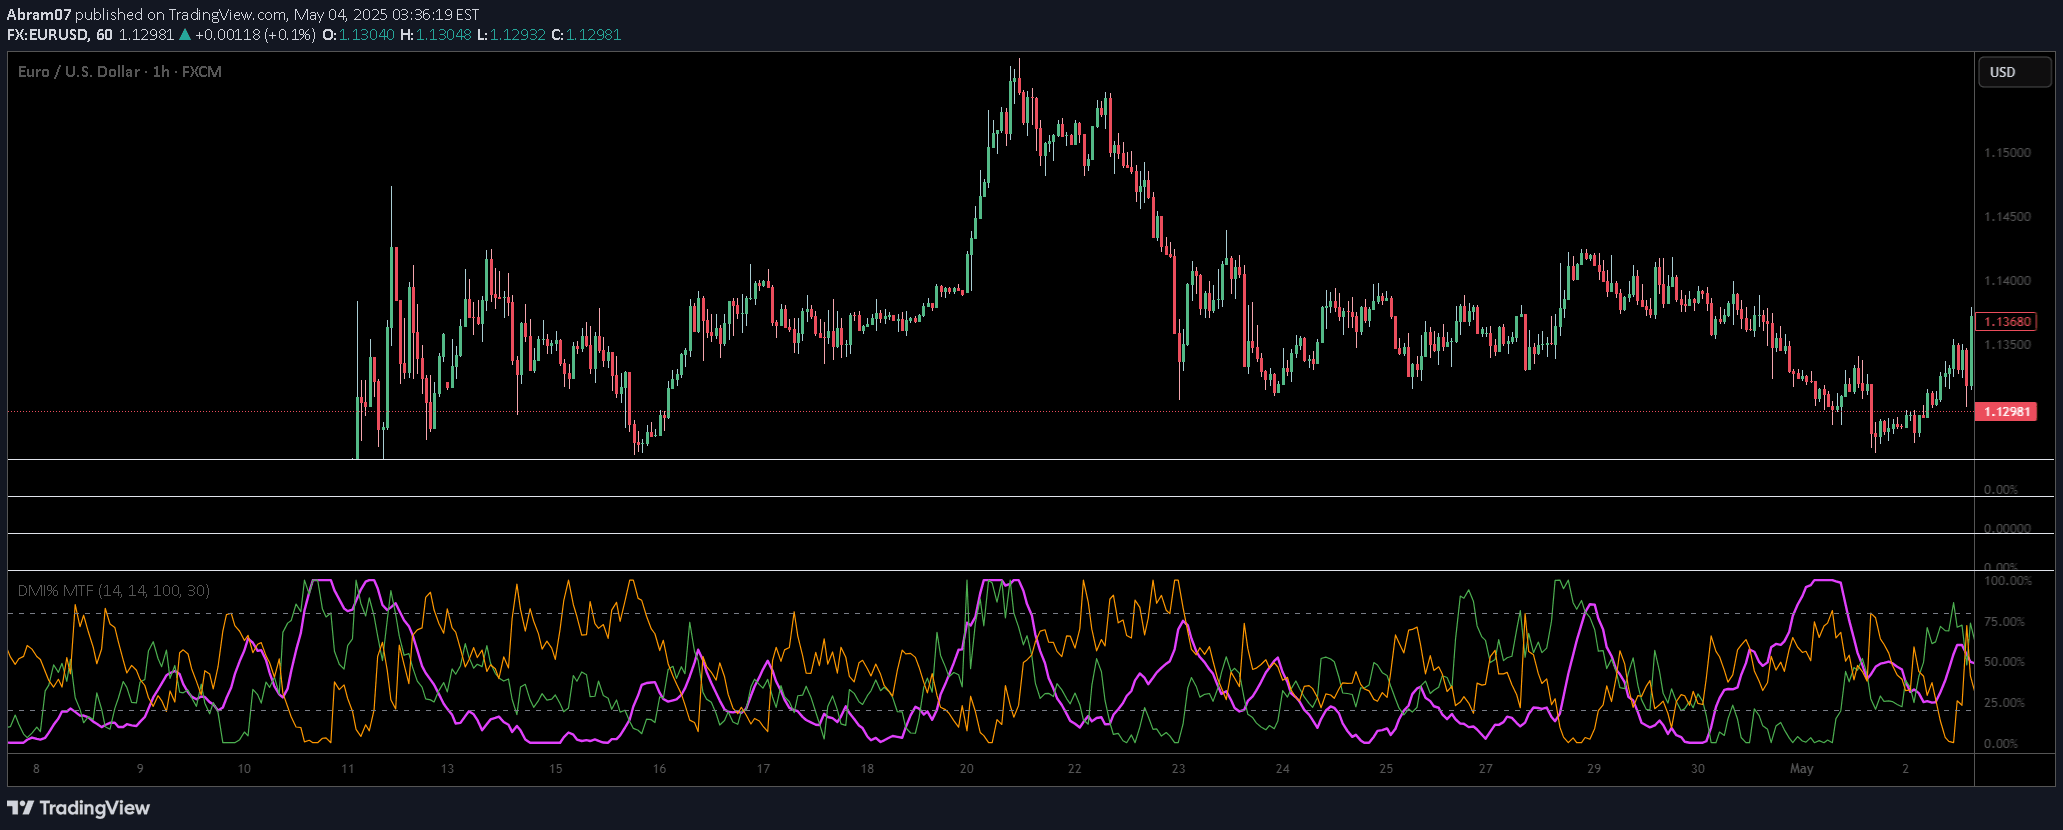
A dual Supertrend indicator that uses two different ATR lengths to help traders identify market trends and potential reversals with enhanced precision and adaptability.
Explore complementary indicator rolesHow it works
The PT Supertrend Custom indicator calculates two independent Supertrend lines using different Average True Range (ATR) parameters. Each line is plotted with customizable ATR lengths and multipliers, generating distinct trend signals based on price movements and volatility.
When the price is above the Supertrend lines, it indicates an uptrend (green), and when below, it signifies a downtrend (red). By comparing these two lines, traders can assess both short-term and long-term trend dynamics, with trend changes occurring when price crosses the respective Supertrend lines.
Why it may be useful
The dual Supertrend approach provides traders with a more comprehensive view of market trends by simultaneously tracking short-term and long-term trend dynamics. This multi-layered analysis helps reduce false signals and increases the probability of identifying genuine trend shifts.
By incorporating different ATR lengths, the indicator adapts to varying market volatilities, making it versatile across different financial instruments and trading conditions. The visual representation of trends through color-coded lines and shaded areas enhances traders' ability to quickly interpret market conditions.
When to explore it
The PT Supertrend Custom indicator is most effective in trending markets with clear directional movements, particularly in volatile asset classes like cryptocurrencies, forex, and high-momentum stocks. It performs exceptionally well when price exhibits consistent directional movement and significant volatility.
Traders should utilize this indicator during periods of established trends, using the shorter ATR period for quicker entries and exits and the longer ATR period for trend confirmation. It is particularly useful in swing trading and day trading strategies where identifying trend strength and potential reversals is crucial.
Keep exploring
What we’ve verified
Access, alerts and repainting behaviour have not been independently verified for this indicator. Check the creator’s current publication and settings.
General descriptions and classifications are recovered research. Verified details above identify the specific checks we have completed. Check the creator’s current publication for later changes.