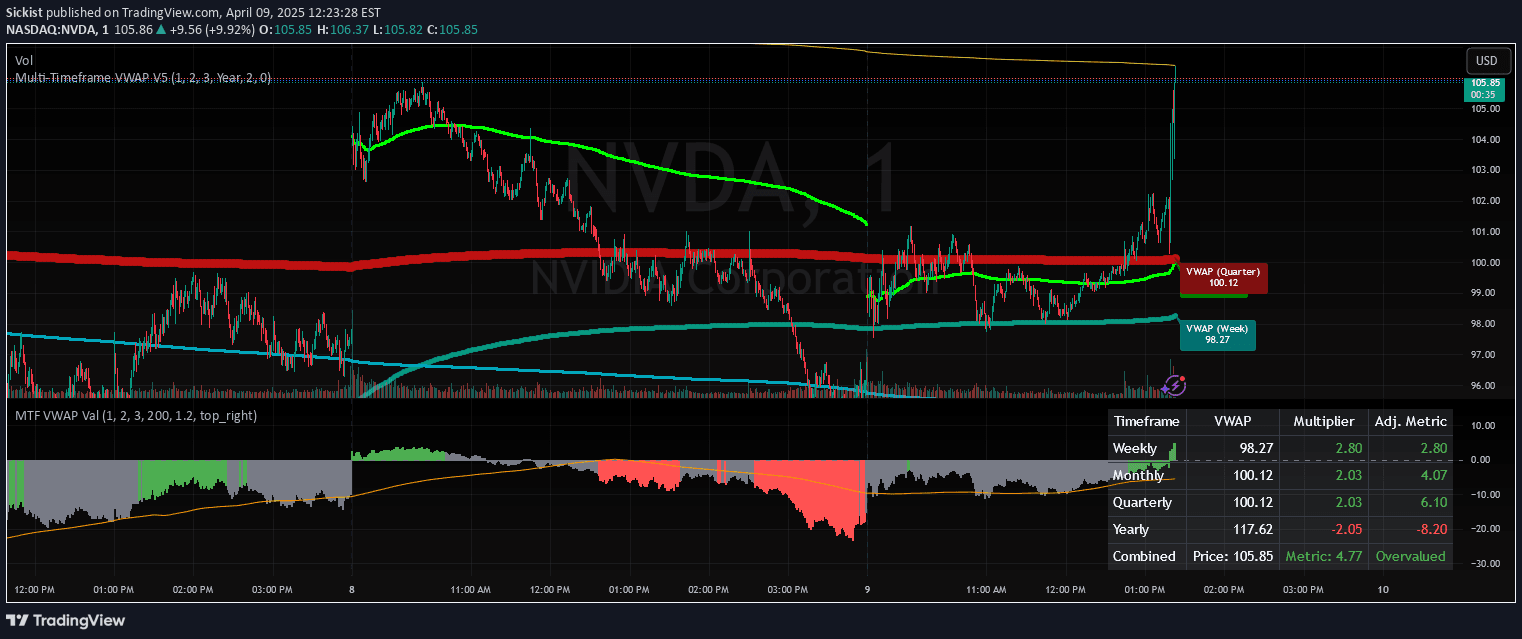
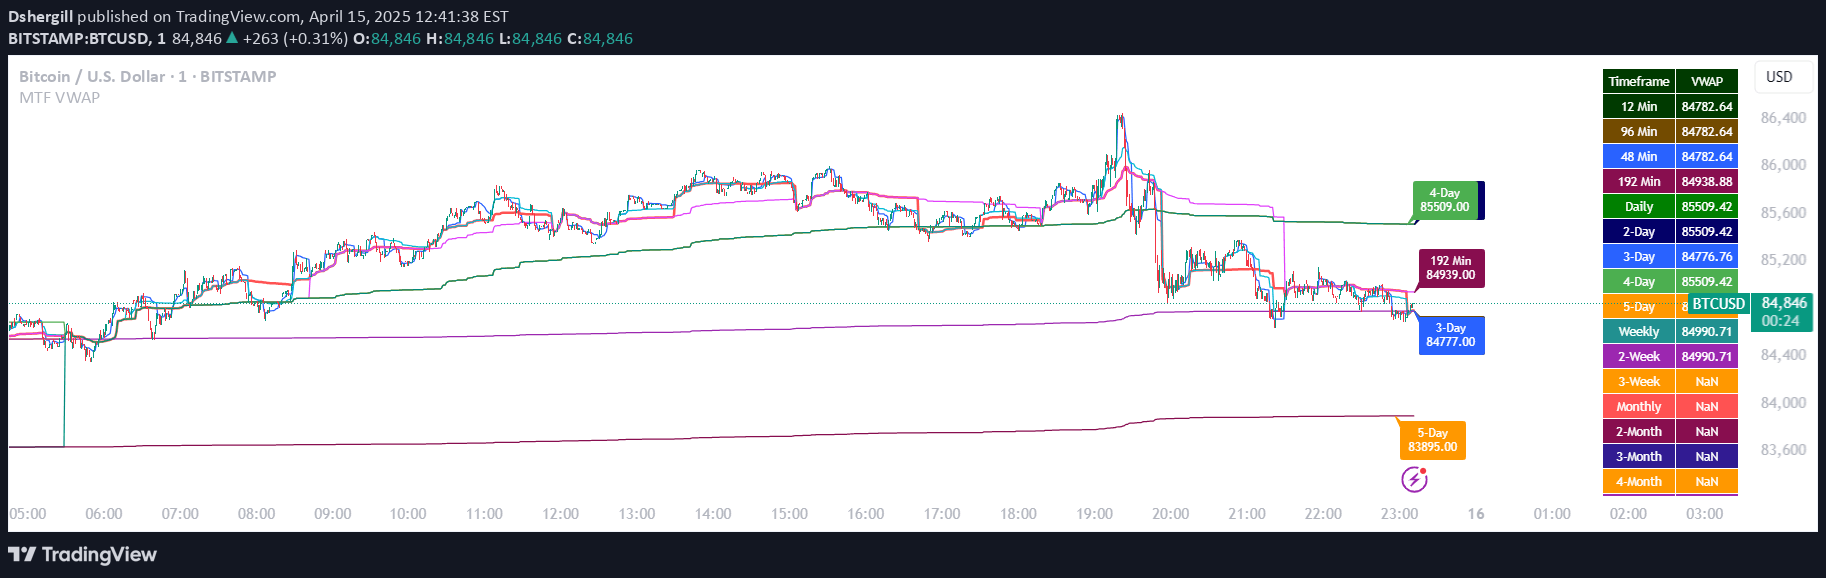
A technical analysis tool using VWAP Z-Score to identify potential market reversals by measuring price deviation from the Volume Weighted Average Price using standard deviations.
Explore complementary indicator rolesHow it works
The VWAP Z-Score calculates the current price's deviation from the Volume Weighted Average Price by measuring how many standard deviations away the price is from the VWAP. It computes this by comparing the current price to the VWAP and dividing the difference by the standard deviation of prices over a specified period.
The indicator generates visual signals when the Z-Score crosses predefined upper and lower thresholds, indicating potential overbought or oversold conditions. When the Z-Score crosses below the upper threshold, it suggests a potential sell signal, and when it crosses above the lower threshold, it indicates a potential buy signal.
Why it may be useful
The VWAP Z-Score helps traders understand price dynamics by revealing how far the current price has deviated from its average volume-weighted price. By quantifying price movements in terms of standard deviations, it provides a statistically grounded perspective on market conditions and potential reversals.
This tool is valuable because it combines volume and price information, offering insights into market sentiment and potential trend changes. It helps traders identify extreme price movements and potential entry or exit points by highlighting when prices have moved significantly away from their typical range.
When to explore it
The VWAP Z-Score is most effective in markets with clear price trends and consistent volume, such as highly liquid stocks, major currency pairs, and actively traded commodities. It works best when markets are experiencing identifiable momentum and when traders want to confirm potential trend reversals.
Traders should use this indicator in conjunction with other technical analysis tools to validate signals and reduce false positives. It is particularly useful during periods of market volatility, when price movements might deviate significantly from average conditions, providing valuable insights into potential trading opportunities.
Keep exploring
What we’ve verified
Access, alerts and repainting behaviour have not been independently verified for this indicator. Check the creator’s current publication and settings.
General descriptions and classifications are recovered research. Verified details above identify the specific checks we have completed. Check the creator’s current publication for later changes.