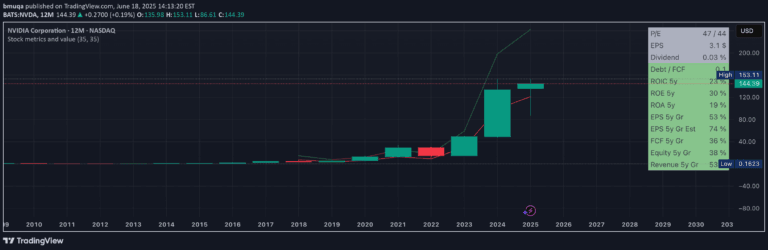
A comprehensive stock valuation method that combines multiple financial metrics to assess stock value using a multi-factor rainbow spectrum approach.
Explore complementary indicator rolesHow it works
The Stock Value Rainbow calculates stock valuation by aggregating key financial metrics including book value per share, dividends per share, cash flow per share, earnings per share, and earnings estimates. These metrics are then multiplied by a money multiplier ranging from 1x to 10x to create a comprehensive valuation spectrum.
The resulting calculation generates a visual rainbow representation where different multiplication factors reveal the stock's potential growth and relative valuation. Higher positions on the rainbow indicate more expensive stocks, while lower positions suggest more affordable investment opportunities.
Why it may be useful
This valuation method provides investors with a holistic view of a stock's intrinsic value by incorporating multiple financial dimensions beyond traditional single-metric assessments. It helps traders understand the comprehensive financial health and potential growth trajectory of a stock by synthesizing diverse financial indicators.
By using a multi-factor approach, the Stock Value Rainbow reduces the risk of making investment decisions based on limited or narrow financial perspectives. The rainbow visualization makes complex financial data more accessible and intuitive, enabling investors to quickly assess a stock's relative value and potential.
When to explore it
The Stock Value Rainbow is most effective for investors seeking a comprehensive, multi-dimensional approach to stock valuation during fundamental analysis and long-term investment strategy development. It is particularly useful when evaluating stocks across different sectors and comparing their relative financial performance.
Traders should employ this method when conducting in-depth research on potential investments, looking for stocks with strong fundamental indicators and sustainable growth potential. The approach is especially valuable for swing traders and long-term investors who prioritize understanding a company's financial robustness beyond short-term price movements.
Keep exploring
What we’ve verified
Access, alerts and repainting behaviour have not been independently verified for this indicator. Check the creator’s current publication and settings.
General descriptions and classifications are recovered research. Verified details above identify the specific checks we have completed. Check the creator’s current publication for later changes.