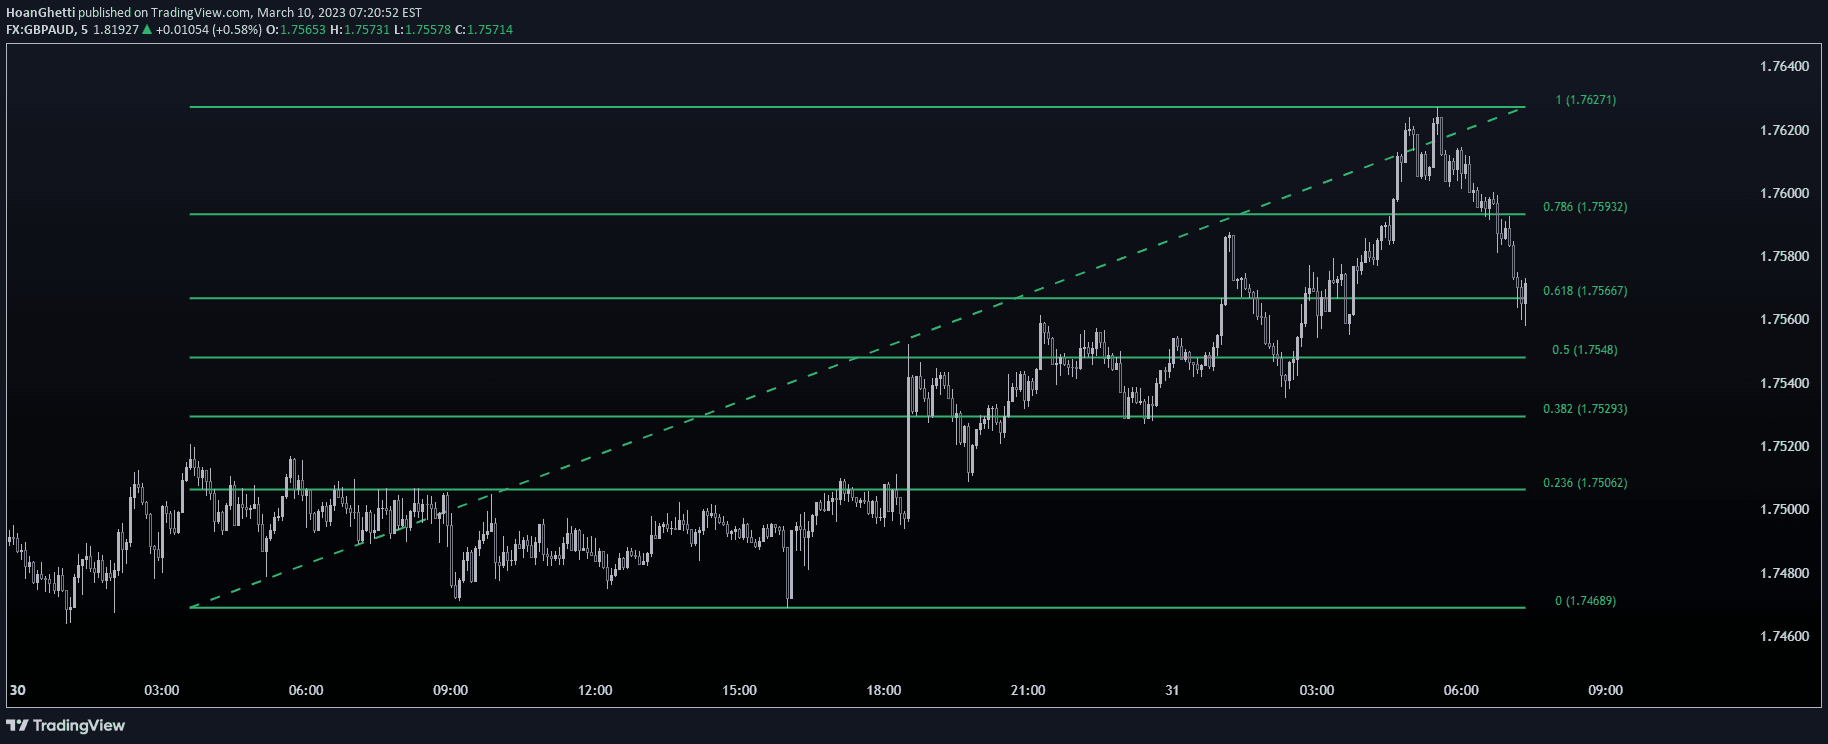
A Fibonacci Retracement tool that calculates potential support and resistance levels across multiple timeframes using both linear and logarithmic scales.
Explore complementary indicator rolesHow it works
The Fibonacci Retracement indicator begins by identifying the highest and lowest price points within a specified timeframe, establishing a trend direction based on these points. It then applies Fibonacci sequence-derived ratios to calculate potential support and resistance levels, creating a mathematical framework for predicting potential price reversal points.
The script uses two primary functions: f_ret() to generate levels based on a multiplier parameter, and f_print() to visualize these levels on the chart. By drawing lines at key Fibonacci ratios, the indicator provides traders with a structured approach to understanding potential price retracements and trend continuation zones.
Why it may be useful
Fibonacci Retracement offers traders a systematic method for identifying potential support and resistance levels based on mathematical relationships inherent in market movements. By providing a structured approach to analyzing price action, it helps traders make more informed decisions about potential entry and exit points in their trading strategies.
The indicator's ability to work across multiple timeframes and in both linear and logarithmic scales makes it a versatile tool for understanding market dynamics. It helps traders anticipate potential price reversals and confirm trend strengths, providing a mathematical perspective to technical analysis that can complement other trading indicators.
When to explore it
Fibonacci Retracement works best during clear trending markets where there are significant price movements that can be analyzed using the Fibonacci ratios. Traders should look for strong trending periods in both bullish and bearish markets, where the retracement levels can provide meaningful insights into potential support and resistance zones.
The indicator is particularly useful when combined with other technical analysis tools, such as trend indicators or momentum oscillators. Traders should pay special attention to the levels when they coincide with other technical signals, as this can provide stronger confirmation of potential price reversals or continuation patterns.
Keep exploring
What we’ve verified
Access, alerts and repainting behaviour have not been independently verified for this indicator. Check the creator’s current publication and settings.
General descriptions and classifications are recovered research. Verified details above identify the specific checks we have completed. Check the creator’s current publication for later changes.