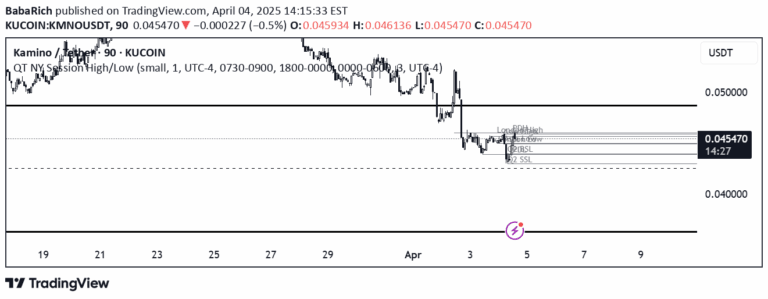
Fibonacci retracement tool that plots dynamic levels based on current and prior session highs and lows. Provides customizable visual reference points for potential support and resistance zones.
Explore complementary indicator rolesHow it works
Fibonacci retracement levels are calculated by identifying a price swing's high and low points and then drawing horizontal lines at key percentage levels derived from the Fibonacci sequence. These levels typically include 23.6%, 38.2%, 50%, 61.8%, and 100%, which represent potential areas of price consolidation or reversal.
The tool automatically plots these levels on the current trading session's price range, allowing traders to quickly visualize potential support and resistance zones. By offering toggles for prior and current session levels, traders can compare different time frames and gain additional context about potential price movements.
Why it may be useful
Fibonacci retracement levels provide traders with a mathematical framework for understanding potential price reversal or consolidation zones based on natural market rhythms. These levels help identify key psychological price points where traders might expect increased buying or selling pressure, potentially improving entry and exit decision-making.
By offering customizable levels and color options, the tool allows traders to personalize their analysis and adapt the indicator to their specific trading style and preferences. The ability to toggle between current and prior session levels adds flexibility and depth to technical analysis strategies.
When to explore it
Fibonacci retracement levels are most effective in trending markets with clear directional movement, where price tends to respect these mathematical levels more consistently. They work particularly well in liquid markets with high trading volume, such as major currency pairs, stock indices, and prominent individual stocks.
Traders should use these levels in conjunction with other technical indicators to confirm potential support and resistance zones. They are especially useful during trending market conditions, when price is more likely to respect and bounce from these mathematically derived levels.
Keep exploring
What we’ve verified
Access, alerts and repainting behaviour have not been independently verified for this indicator. Check the creator’s current publication and settings.
General descriptions and classifications are recovered research. Verified details above identify the specific checks we have completed. Check the creator’s current publication for later changes.