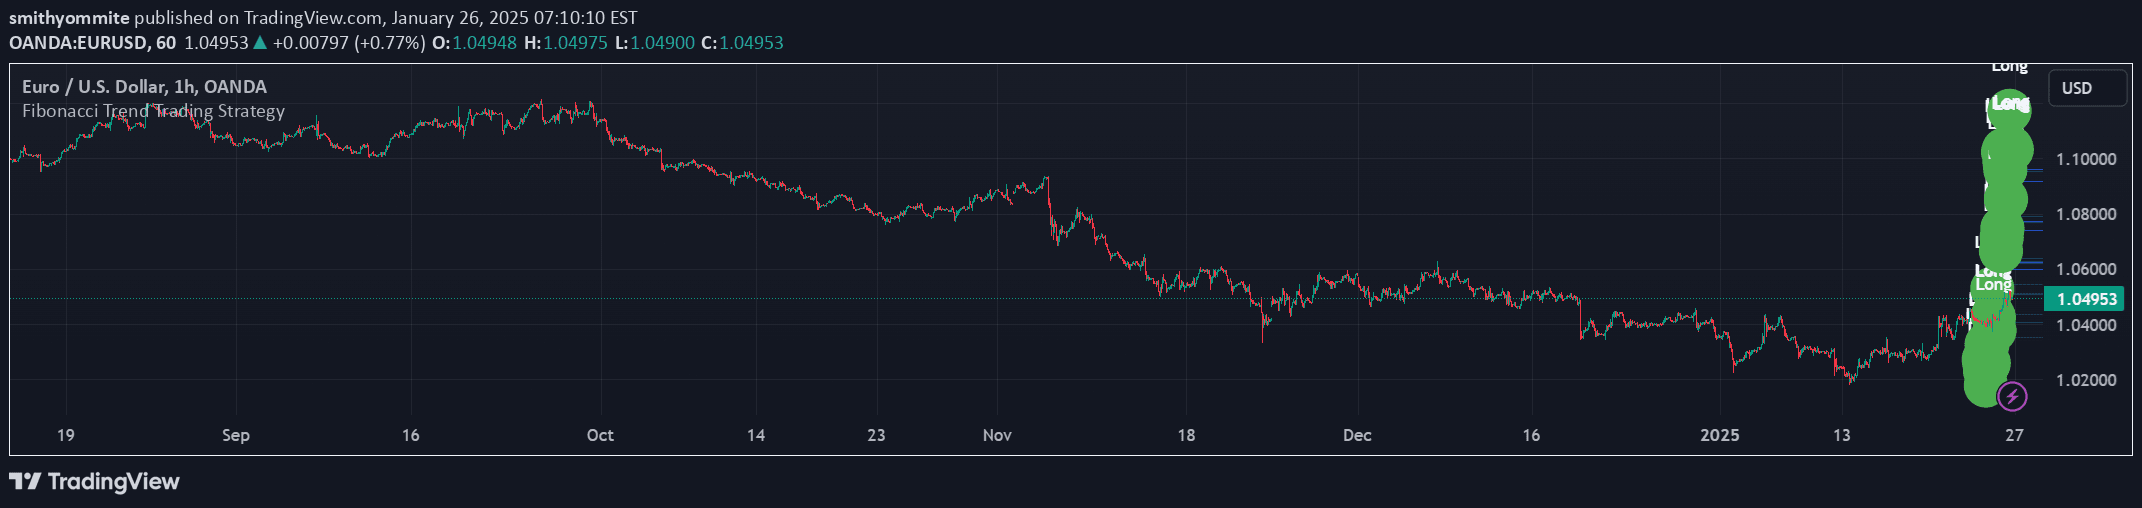
A technical analysis tool using Fibonacci levels to identify potential support and resistance zones through both linear and logarithmic methods across different financial instruments.
Explore complementary indicator rolesHow it works
The Fibonacci Levels indicator calculates potential support and resistance levels by measuring the distance between a selected swing high and swing low. It uses two primary methods: linear levels and logarithmic levels, which divide the measured distance into proportional segments based on Fibonacci ratios like 0.236, 0.382, and 0.618.
In the linear method, the 1-unit distance is divided equally, while the logarithmic method uses progressively smaller, proportionally equal distances. Traders can customize the levels and reference points, similar to the Trading View Fibonacci Tool, allowing for flexible and precise level identification across various financial instruments.
Why it may be useful
Fibonacci levels provide traders with a systematic approach to identifying potential price reversal or continuation zones based on mathematical ratios derived from market movements. By offering both linear and logarithmic calculations, the indicator allows for more nuanced analysis across different market conditions and instrument types.
The tool's unique design enables traders to view multiple level types without altering the chart's scaling, which prevents potential errors in other indicators and maintains the integrity of trend line and price alert settings. This flexibility makes it particularly valuable for analyzing volatile markets like cryptocurrencies, stocks with extreme price variations, and markets experiencing significant economic fluctuations.
When to explore it
The Fibonacci Levels indicator is most effective in markets experiencing high volatility, such as cryptocurrency trading, particularly for instruments like Bitcoin. It works exceptionally well for analyzing assets with significant price movements or those trading in markets with economic instability.
Traders can utilize this tool when seeking to identify potential accumulation and distribution zones, especially in altcoins with substantial market capitalization and trading volume. It is particularly useful for stocks with highly inflated or deflated prices, emerging market indices, and currency pairs experiencing economic challenges.
Keep exploring
What we’ve verified
Access, alerts and repainting behaviour have not been independently verified for this indicator. Check the creator’s current publication and settings.
General descriptions and classifications are recovered research. Verified details above identify the specific checks we have completed. Check the creator’s current publication for later changes.