
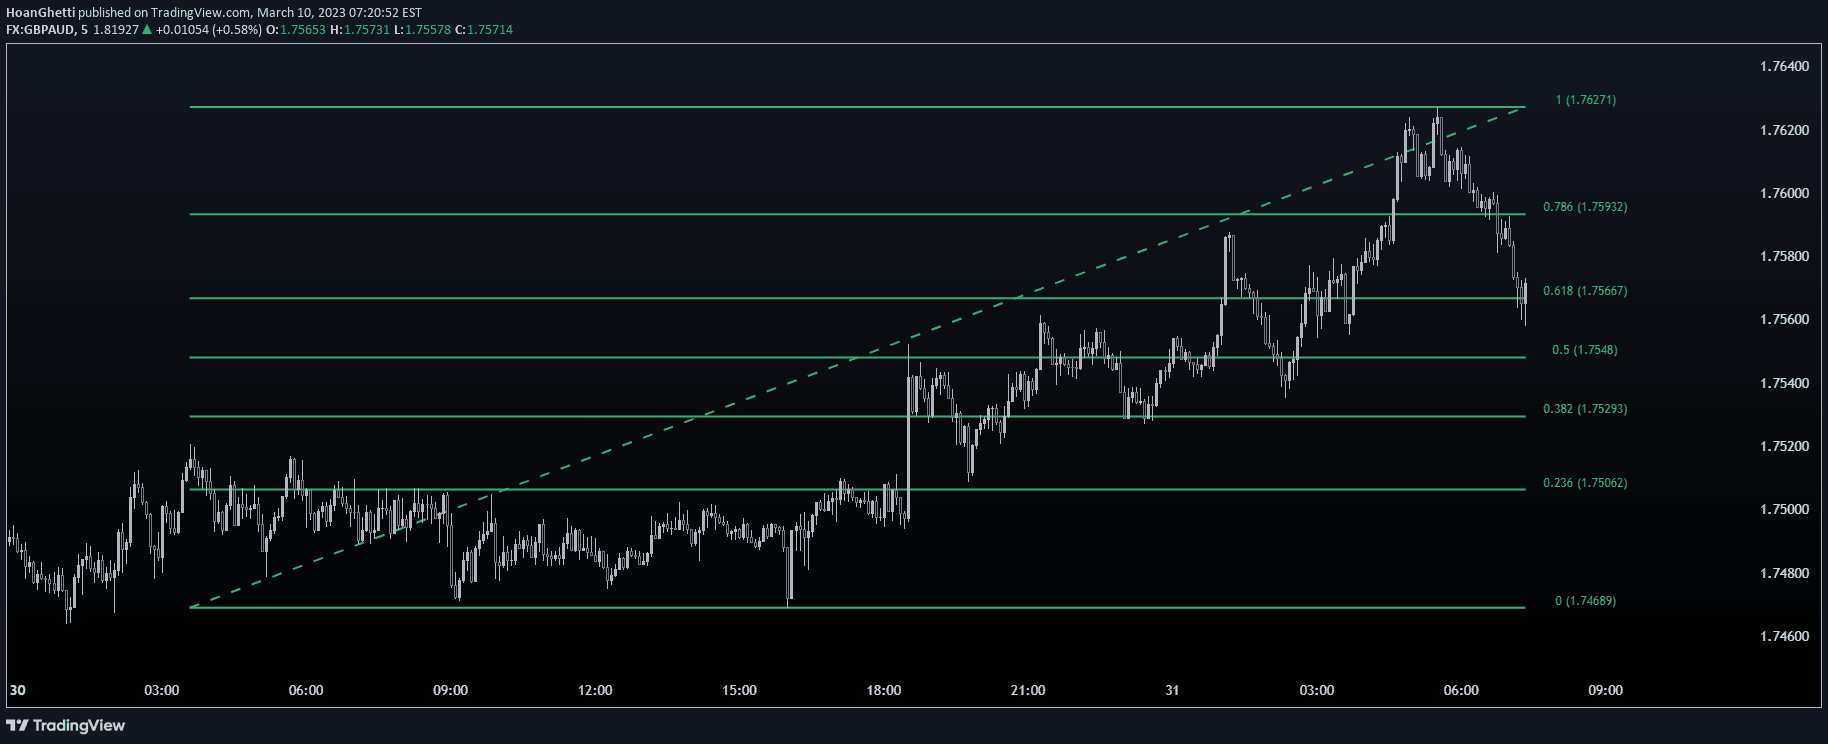
A dynamic Fibonacci retracement tool that automatically adjusts trendlines and levels based on current price movement, providing adaptive support and resistance analysis.
Explore complementary indicator rolesHow it works
The Fibonacci retracement tool dynamically calculates key price levels by automatically identifying and tracking the most recent significant price swing. It establishes top and bottom reference points that adjust in real-time as price moves, creating a flexible framework for potential support and resistance zones.
As price progresses, the tool recalculates and updates Fibonacci levels, ensuring that traders always have an adaptive view of potential retracement points. The auto-trendline feature helps identify the most relevant price swings, while the auto-level adjustment ensures continuous, precise tracking of potential reversal or continuation zones.
Why it may be useful
Fibonacci retracement provides traders with a mathematically-based method for identifying potential price reversal or continuation zones, offering a structured approach to understanding market psychology and potential price movements. By using these natural mathematical ratios, traders can gain insights into potential support and resistance levels that might not be immediately visible on a standard price chart.
The dynamic nature of this tool makes it particularly valuable, as it adapts to changing market conditions and provides real-time insights. Traders can use these levels to make more informed decisions about entry points, stop losses, and potential profit targets, enhancing overall trading strategy and risk management.
When to explore it
The Fibonacci retracement tool is most effective in trending markets where price shows clear directional movement and predictable retracement patterns. It works exceptionally well in markets with consistent momentum, helping traders identify potential pullback levels during strong trends in stocks, forex, or commodities.
Traders should utilize this tool during periods of sustained price movement, particularly when transitioning between different market phases. It is especially useful for confirming potential entry and exit points, managing risk, and understanding the underlying market structure during both bullish and bearish market conditions.
Keep exploring
What we’ve verified
Access, alerts and repainting behaviour have not been independently verified for this indicator. Check the creator’s current publication and settings.
General descriptions and classifications are recovered research. Verified details above identify the specific checks we have completed. Check the creator’s current publication for later changes.


