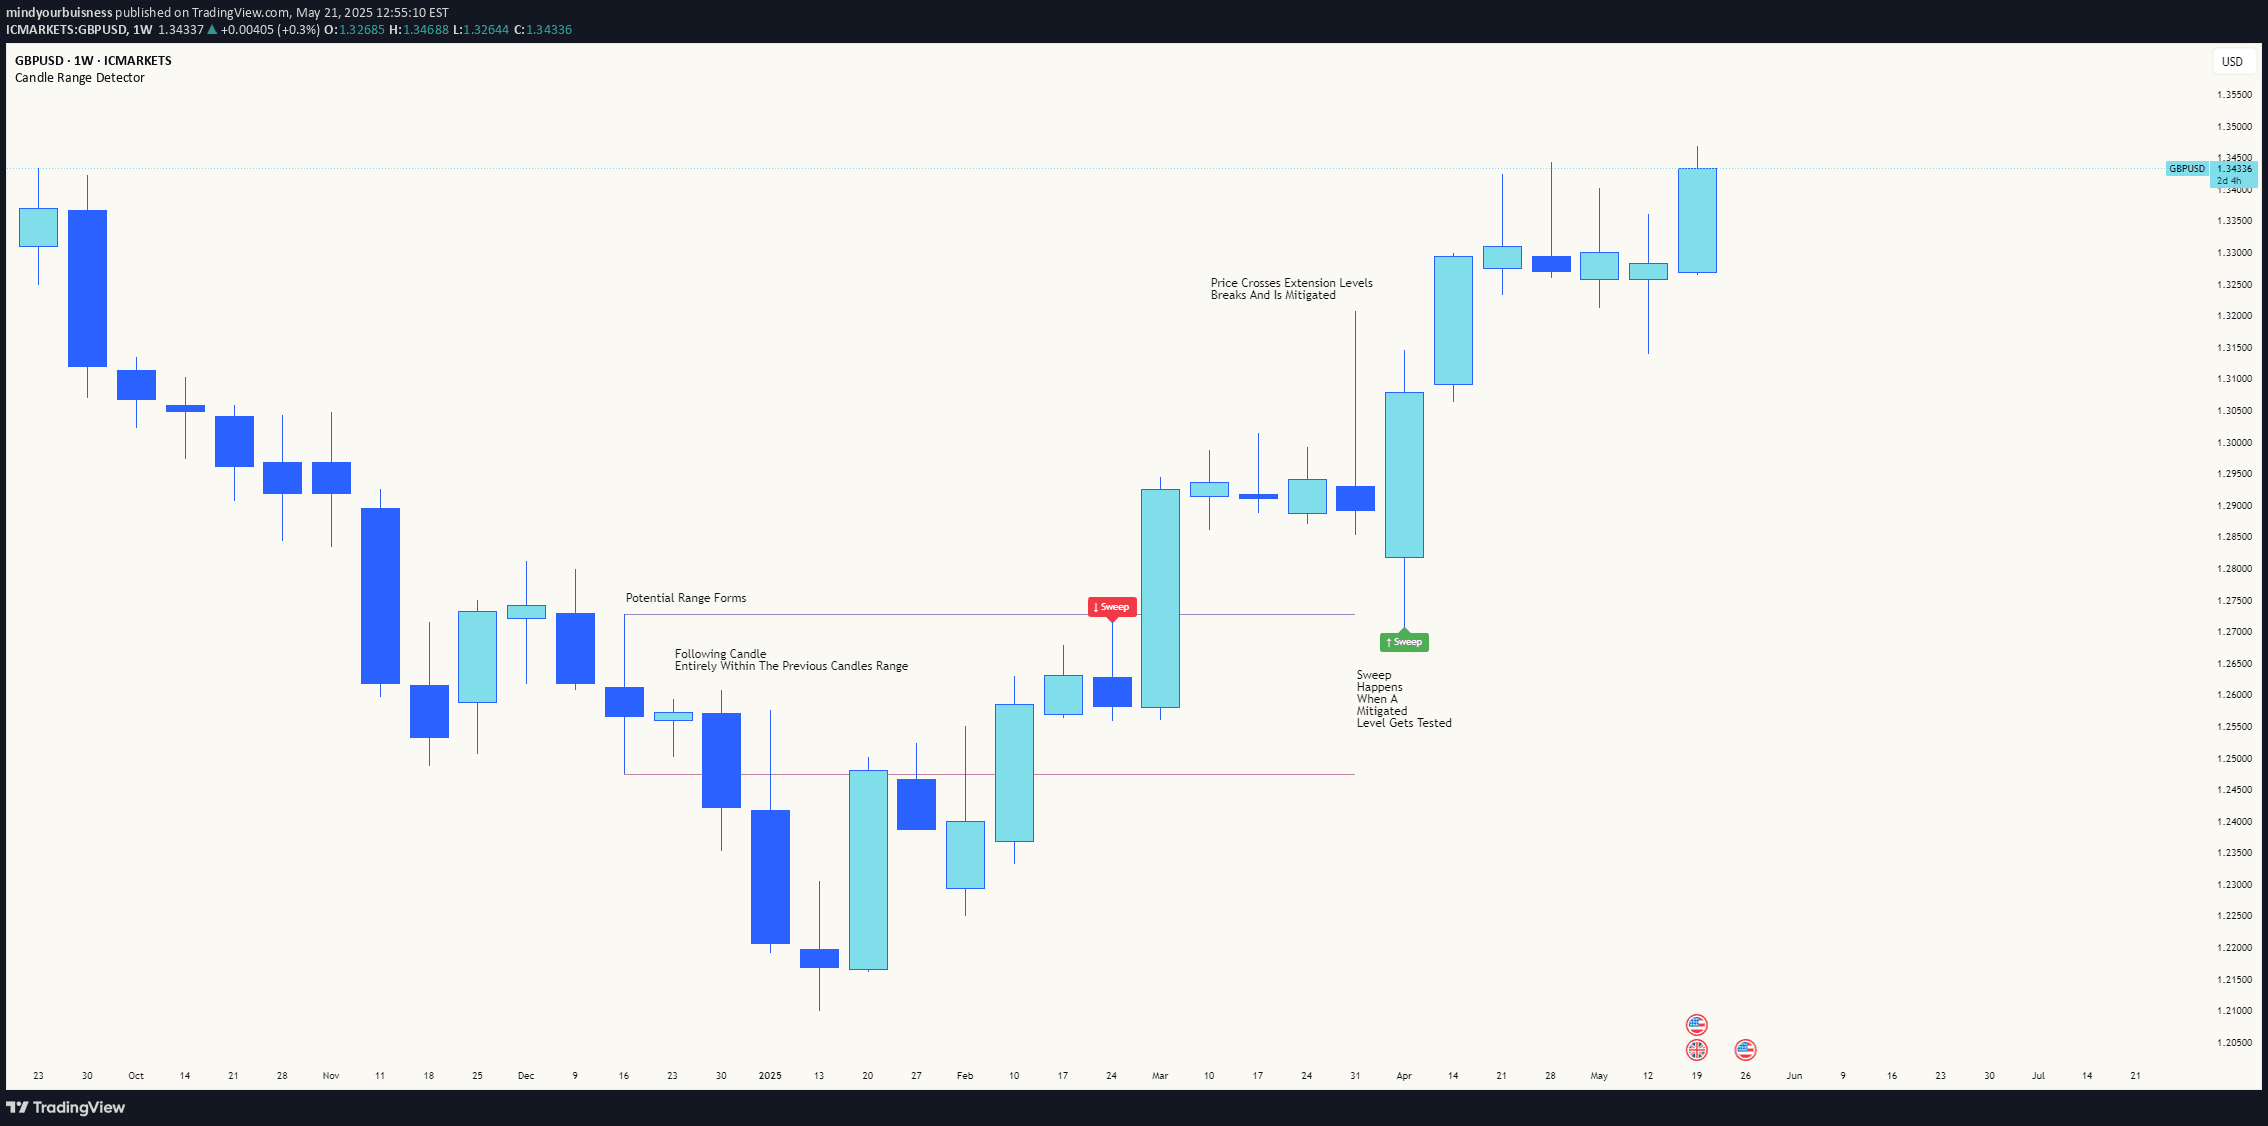
A sophisticated range detection indicator that uses fibonacci relationships and volume profile to identify and validate significant trading ranges with advanced breakout and reversal analysis.
Explore complementary indicator rolesHow it works
The Smart Range Detector analyzes price action using pivot point analysis and logarithmic fibonacci relationships to automatically identify significant trading ranges. It detects specific pivot patterns like High-Low-High and Low-High-Low, then validates these ranges using advanced fibonacci calculations to filter out market noise.
The indicator continuously monitors each detected range for potential mitigation events or breakouts, displaying internal fibonacci levels at 25%, 50%, and 75% to help traders identify potential reversal points. Additionally, it generates extension levels beyond the ranges to provide potential breakout targets and includes a volume profile analysis to enhance trading insights.
Why it may be useful
Traditional range indicators often provide simplistic box drawings without meaningful validation, which can lead traders to make low-probability trading decisions. This indicator addresses that limitation by incorporating sophisticated fibonacci validation and volume analysis, ensuring that only statistically significant ranges are highlighted.
By combining multiple analytical techniques like pivot point detection, logarithmic fibonacci calculations, and volume profile analysis, traders gain a more comprehensive view of market structure. The result is a powerful tool that helps identify high-probability trading opportunities with greater precision and context than standard range detection methods.
When to explore it
The Smart Range Detector is most effective on timeframes ranging from 5-minute to daily charts, making it versatile for various trading styles and market conditions. It works particularly well in markets that exhibit clear ranging behavior, helping traders identify potential entry and exit points with greater confidence.
Traders should leverage this indicator during periods of consolidation or when markets are showing clear sideways movement. It is especially useful for swing traders, range traders, and breakout strategists who want to systematically analyze price structure and volume distribution within trading ranges.
Keep exploring
What we’ve verified
Access, alerts and repainting behaviour have not been independently verified for this indicator. Check the creator’s current publication and settings.
General descriptions and classifications are recovered research. Verified details above identify the specific checks we have completed. Check the creator’s current publication for later changes.