
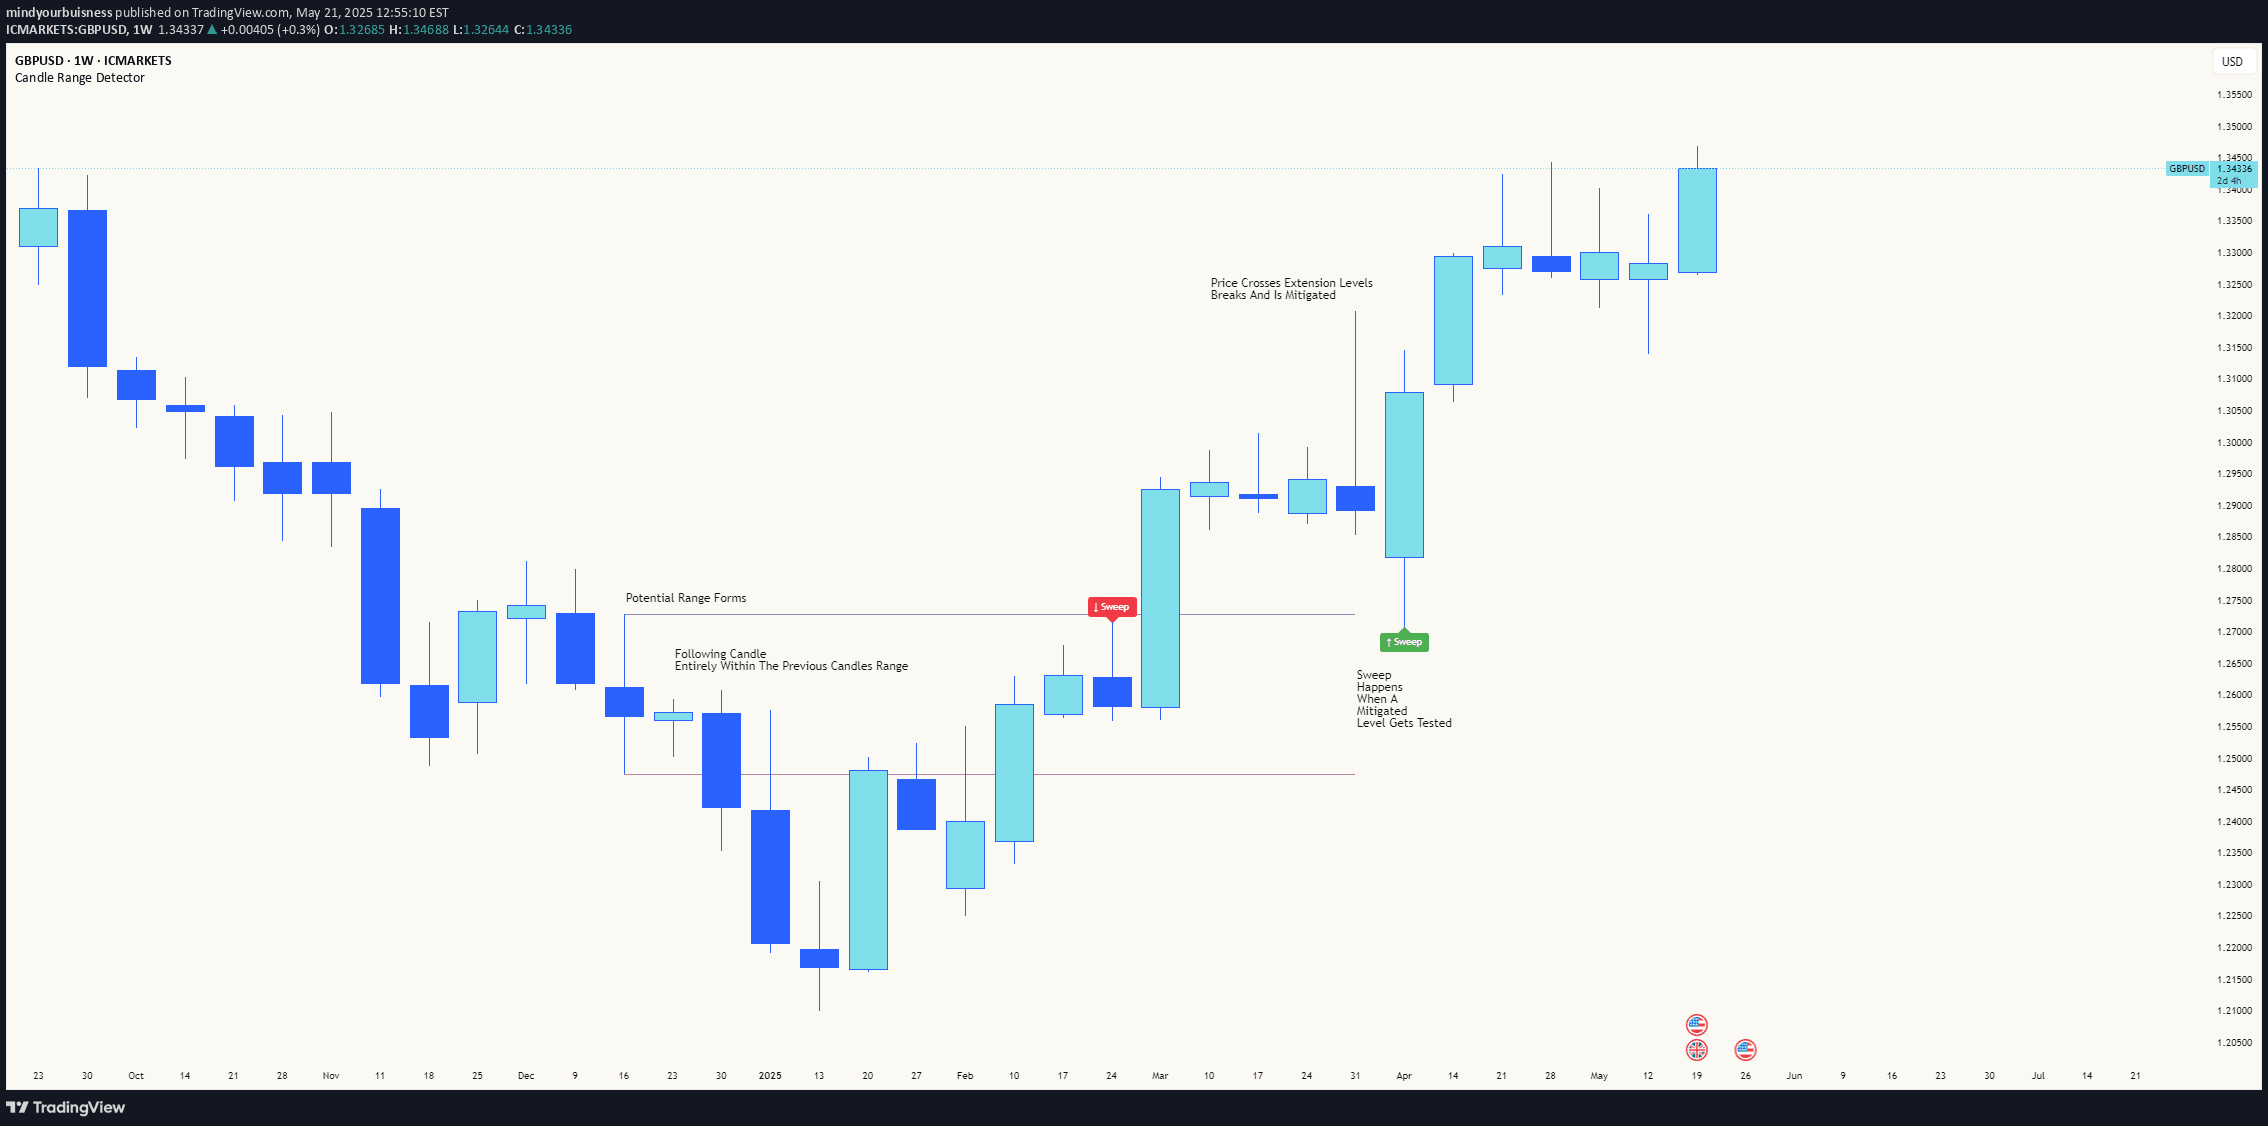
An advanced trading indicator that detects price ranges, tracks range mitigation, and identifies sweep events to highlight potential liquidity zones and market movement signals.
Explore complementary indicator rolesHow it works
The Candle Range Detector works by first identifying price ranges through candle containment, where one candle is completely contained within the previous candle's high and low. This creates a potential liquidity zone or balance area in the market. Once a range is established, the indicator monitors for mitigation, which occurs when price closes beyond the range's extension levels using either standard or Fibonacci-based calculations.
After mitigation, the indicator looks for a sweep event, which is characterized by a candle that trades through the range extreme and closes decisively beyond its log-mid point. This sophisticated approach allows traders to identify precise moments of potential market movement and liquidity capture with a systematic, rules-based methodology.
Why it may be useful
The Candle Range Detector provides traders with a sophisticated tool for understanding market dynamics and liquidity events. By mapping out natural price consolidation zones and tracking their potential breakdown, traders can gain insights into market sentiment and potential directional shifts. The indicator helps identify moments when price is likely to make significant moves, revealing hidden market intentions.
Moreover, the tool's ability to detect sweeps and range mitigations offers traders a strategic advantage in understanding potential stop-loss hunting and liquidity grabs. This approach goes beyond simple price action analysis, providing a more nuanced view of market mechanics and potential trading opportunities across different timeframes.
When to explore it
The Candle Range Detector is most effective in markets with clear ranging or consolidating price action, such as forex, futures, and liquid stock markets. It performs particularly well in timeframes from 1-minute to daily charts, where price movements are more defined and liquidity events are more pronounced. Traders should pay special attention to this indicator during periods of market transition or when price appears to be testing key structural levels.
The indicator is especially valuable during volatile market conditions, earnings seasons, and economic news events where liquidity dynamics can shift rapidly. Traders should combine this tool with other technical and fundamental analysis to confirm signals and develop more robust trading strategies across different market environments.
Keep exploring
What we’ve verified
Access, alerts and repainting behaviour have not been independently verified for this indicator. Check the creator’s current publication and settings.
General descriptions and classifications are recovered research. Verified details above identify the specific checks we have completed. Check the creator’s current publication for later changes.


