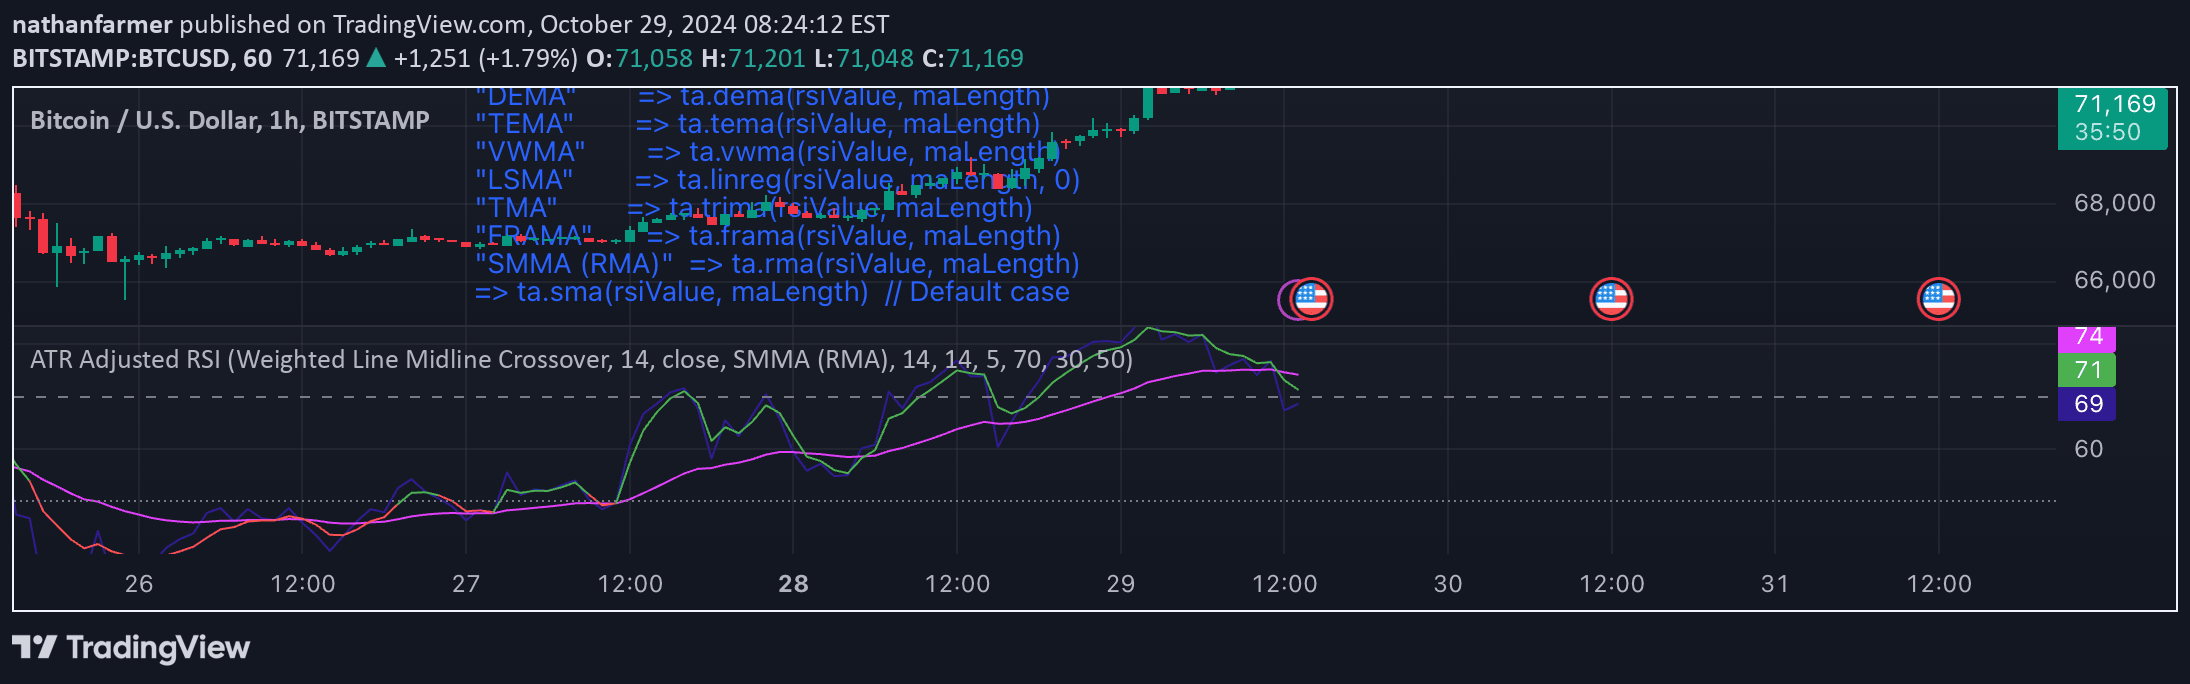
An enhanced RSI indicator that adapts to market momentum using dynamic calculations and smoothing techniques, providing a nuanced view of trend shifts and market conditions.
Explore complementary indicator rolesHow it works
The Adaptive RSI calculates momentum by comparing fast and slow Exponential Moving Averages (EMAs) of the Relative Strength Index. This approach creates a responsive oscillator that dynamically adjusts to changing market conditions, capturing subtle shifts in price momentum more effectively than traditional RSI methods.
The indicator generates dynamic bands using a smoothed standard deviation approach, which helps identify potential overbought and oversold zones. An additional EMA serves as a signal line, providing confirmation of trend directions and helping traders pinpoint potential entry and exit points with greater precision.
Why it may be useful
Traditional momentum indicators often lag behind market movements, providing delayed signals that can reduce trading effectiveness. The Adaptive RSI addresses this limitation by creating a more responsive and adaptive tool that can quickly detect subtle changes in market momentum, allowing traders to make more timely and informed decisions.
By incorporating multiple layers of calculation - including fast and slow EMAs, dynamic bands, and a signal line - this indicator offers a comprehensive view of market conditions. Traders can gain deeper insights into potential trend reversals, momentum shifts, and market extremes, enhancing their overall analytical capabilities.
When to explore it
The Adaptive RSI is most effective in markets with moderate to high volatility, where rapid momentum changes can signal potential trading opportunities. It works particularly well in trending markets, helping traders identify potential entry and exit points by detecting momentum shifts and overbought or oversold conditions.
Traders should use this indicator in conjunction with other technical analysis tools to confirm signals and reduce false positives. It is especially useful for short to medium-term trading strategies across various financial instruments, including stocks, forex, cryptocurrencies, and futures markets.
Keep exploring
What we’ve verified
Access, alerts and repainting behaviour have not been independently verified for this indicator. Check the creator’s current publication and settings.
General descriptions and classifications are recovered research. Verified details above identify the specific checks we have completed. Check the creator’s current publication for later changes.