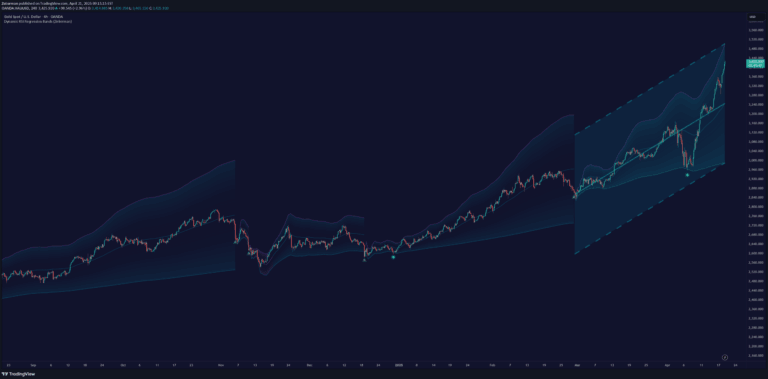
Advanced CCI-based divergence indicator that identifies momentum shifts through complex wave visualization and multi-level divergence detection across different market conditions.
Explore complementary indicator rolesHow it works
The CCI Divergence Indicator analyzes price action and the Commodity Channel Index to detect momentum discrepancies. It uses adaptive pivot detection with three sensitivity levels to identify significant highs and lows in both price and CCI values, enabling precise divergence recognition.
The system classifies divergences into regular bullish and bearish types, automatically rating their strength based on price differentials, CCI magnitude, and time between pivot points. It employs advanced gradient visualization with multi-layer wave effects that dynamically adjust based on market volatility, providing traders with intuitive visual feedback about market momentum.
Why it may be useful
This indicator provides traders with a sophisticated tool for understanding market momentum and potential trend reversals. By combining complex mathematical analysis with intuitive visual representation, it offers deeper insights into market dynamics that traditional oscillators might miss.
The comprehensive divergence detection system helps traders identify potential trend changes earlier and with greater confidence. Its multi-layered approach, including strength classification and adaptive color mapping, transforms raw data into actionable trading intelligence that can significantly enhance decision-making processes.
When to explore it
The CCI Divergence Indicator works best in trending markets where momentum shifts are critical for identifying potential reversals. It is most effective when combined with price action analysis and used across multiple timeframes to confirm signals and reduce false positives.
Traders should utilize this tool in conjunction with other technical indicators and proper risk management protocols. It is particularly valuable for identifying early warning signals in volatile market conditions and providing nuanced momentum readings that go beyond traditional overbought and oversold indicators.
Keep exploring
What we’ve verified
Access, alerts and repainting behaviour have not been independently verified for this indicator. Check the creator’s current publication and settings.
General descriptions and classifications are recovered research. Verified details above identify the specific checks we have completed. Check the creator’s current publication for later changes.