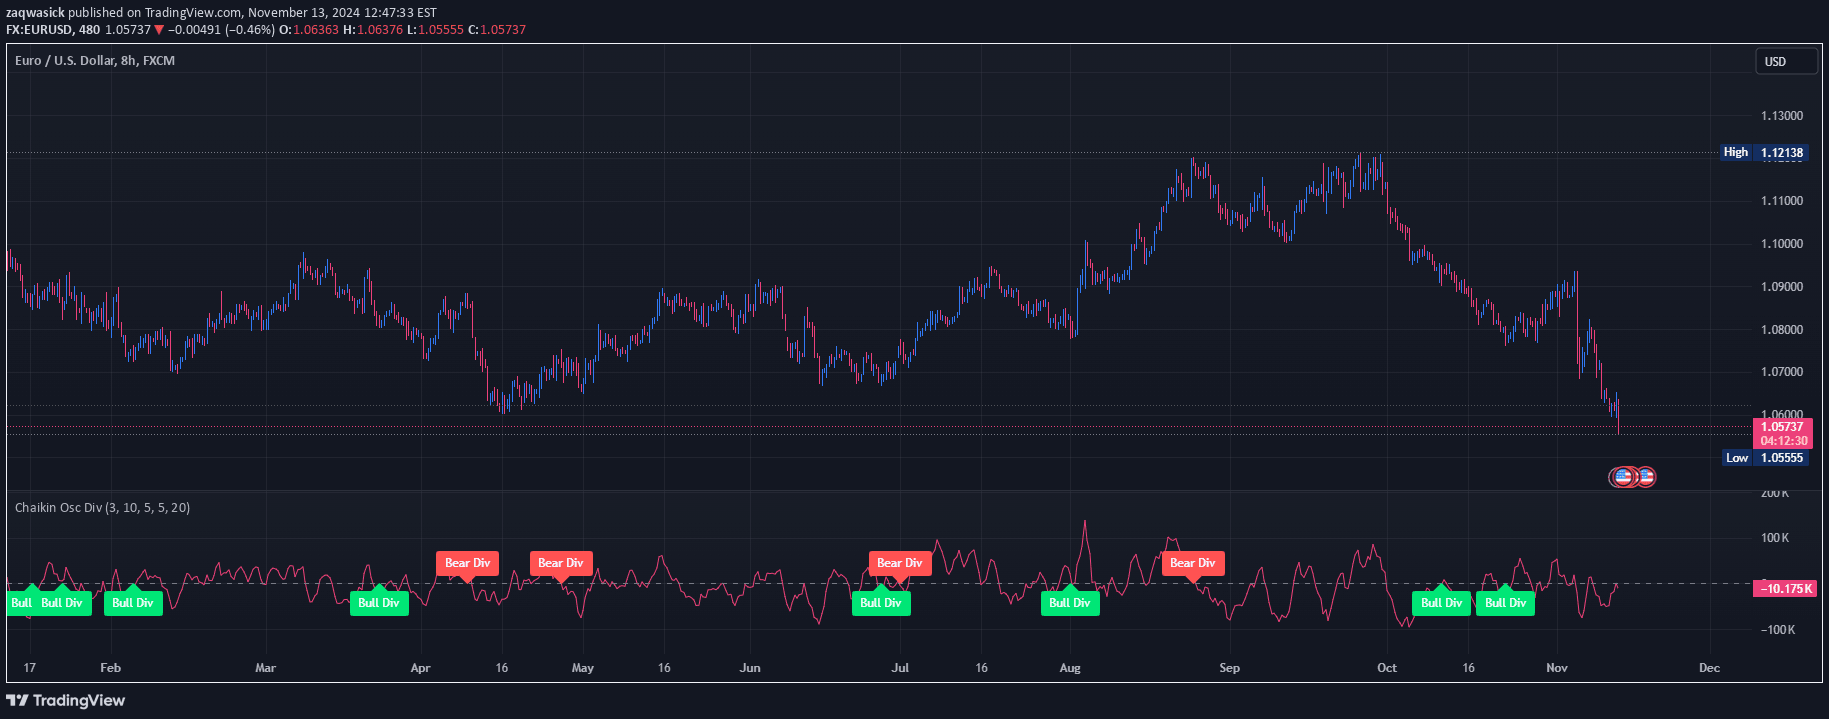
A technical indicator that analyzes the Chaikin Oscillator and detects bullish and bearish divergences to help traders identify potential trend reversals and momentum shifts.
Explore complementary indicator rolesHow it works
The Chaikin Divergence indicator calculates the Chaikin Oscillator by subtracting the slow Exponential Moving Average (EMA) from the fast EMA of the Accumulation/Distribution Line. It uses ta.pivothigh and ta.pivotlow functions to identify significant pivot points in price action.
The indicator then compares these pivot points to detect divergences, where price action and oscillator movements differ. Bullish divergence occurs when price forms lower lows while the oscillator forms higher lows, while bearish divergence happens when price creates higher highs but the oscillator forms lower highs.
Why it may be useful
The Chaikin Divergence provides traders with a powerful tool to anticipate potential trend reversals by highlighting discrepancies between price movement and momentum. By detecting when price and oscillator patterns diverge, traders can gain insights into weakening trends and possible upcoming price changes.
This indicator helps traders make more informed decisions by offering visual signals and quantitative analysis of market momentum. The customizable settings allow traders to adapt the indicator to different market conditions and trading styles, enhancing their ability to identify high-probability trading opportunities.
When to explore it
The Chaikin Divergence works best in trending markets where momentum can provide early signals of potential trend exhaustion or reversal. Traders should look for clear divergence patterns, particularly when the oscillator crosses the zero line or shows significant momentum shifts.
It is most effective when combined with other technical indicators or chart patterns to confirm potential trade setups. Traders should pay special attention to divergence signals during key market phases, such as when price approaches significant support or resistance levels or during periods of market consolidation.
Keep exploring
What we’ve verified
Access, alerts and repainting behaviour have not been independently verified for this indicator. Check the creator’s current publication and settings.
General descriptions and classifications are recovered research. Verified details above identify the specific checks we have completed. Check the creator’s current publication for later changes.