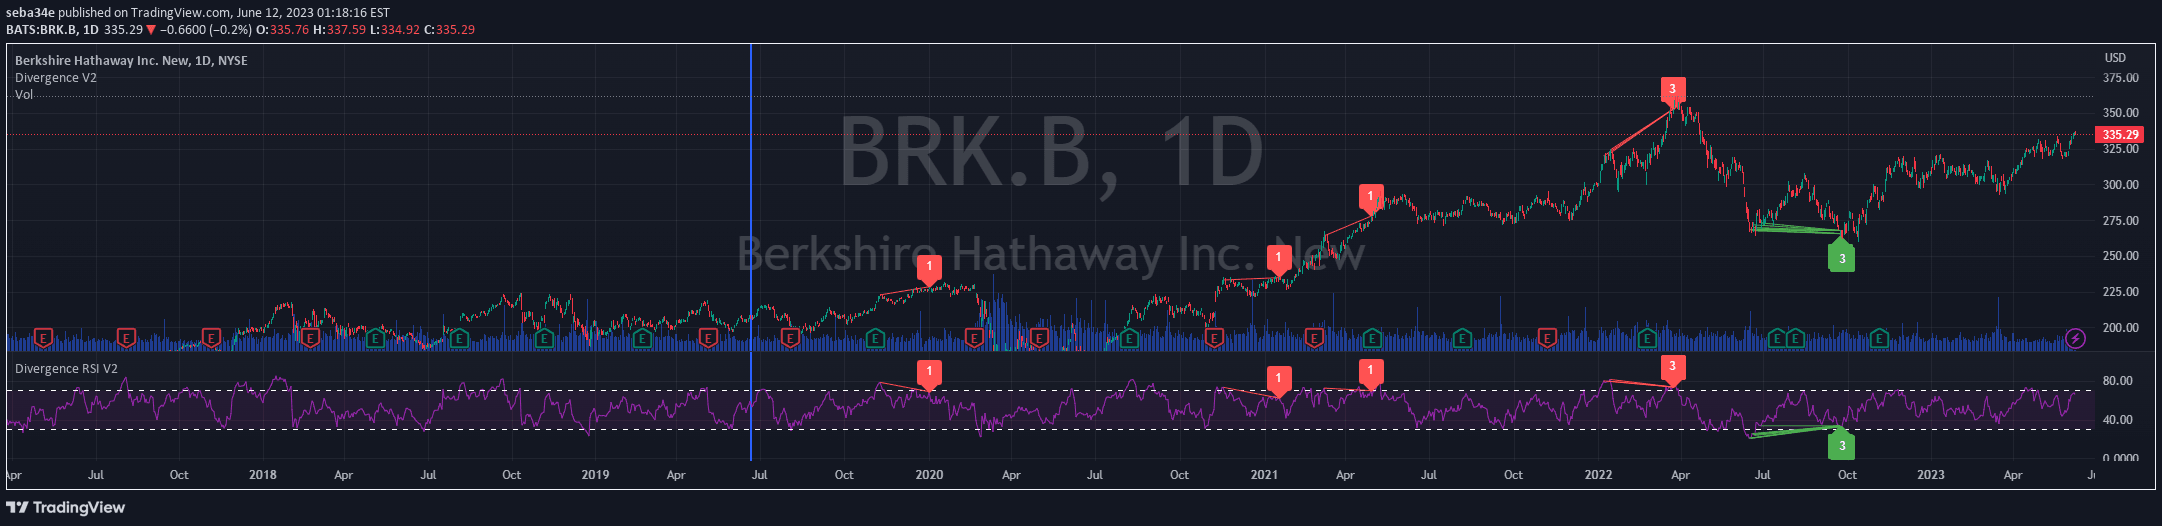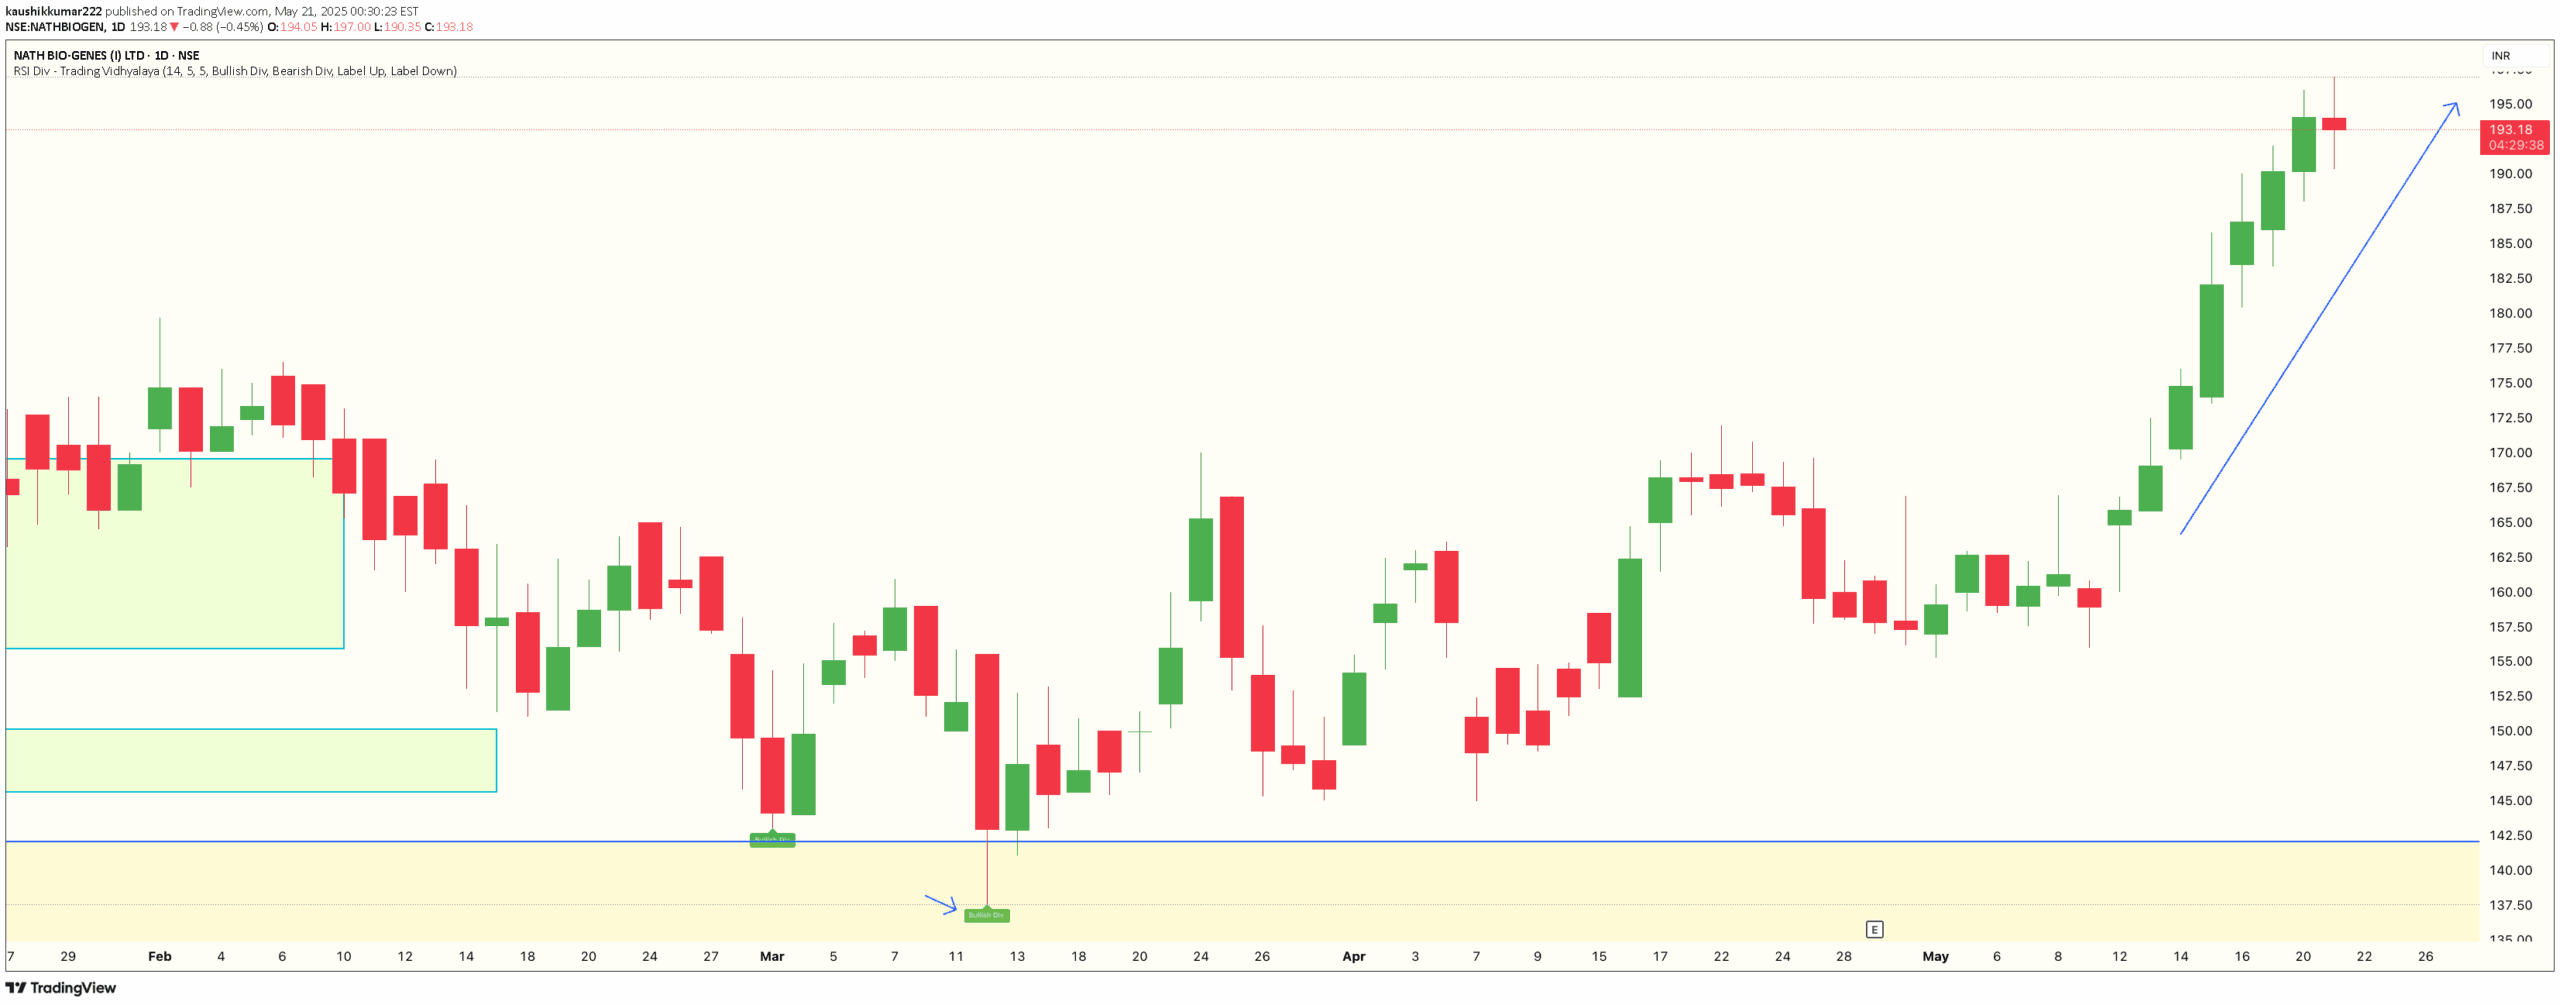
An advanced RSI divergence indicator that automatically identifies and highlights potential trend reversals directly on the candlestick chart using color-coded arrows and labels.
Explore complementary indicator rolesHow it works
The RSI divergence indicator continuously monitors the relationship between price action and the Relative Strength Index (RSI) to detect potential trend reversals. It tracks when price and RSI movements diverge, specifically identifying bullish and bearish divergence patterns in real-time.
For bullish divergence, the indicator looks for situations where price makes a lower low while RSI forms a higher low, suggesting potential upward momentum. Conversely, for bearish divergence, it detects scenarios where price creates a higher high while RSI forms a lower high, signaling possible downward price movement.
Why it may be useful
Divergence signals provide traders with early warning signs of potential trend reversals before they become apparent through traditional price action analysis. By highlighting these critical moments, traders can make more informed decisions about entering or exiting positions with increased confidence.
The indicator's real-time detection and visual overlay on candlestick charts help traders quickly identify and respond to changing market conditions, reducing the likelihood of missing important trading opportunities and minimizing manual analysis time.
When to explore it
The RSI divergence indicator works best in markets with clear trending or ranging characteristics, where price and momentum have discernible patterns. It is particularly effective when used in conjunction with other technical analysis tools like moving averages, MACD, or volume indicators to confirm potential trend reversals.
Traders should exercise caution and not rely solely on divergence signals, as they can sometimes produce false positives. It is recommended to combine this indicator with additional confirmation methods, such as support and resistance levels, candlestick patterns, or other momentum indicators to improve overall trading accuracy.
Keep exploring
What we’ve verified
Access, alerts and repainting behaviour have not been independently verified for this indicator. Check the creator’s current publication and settings.
General descriptions and classifications are recovered research. Verified details above identify the specific checks we have completed. Check the creator’s current publication for later changes.