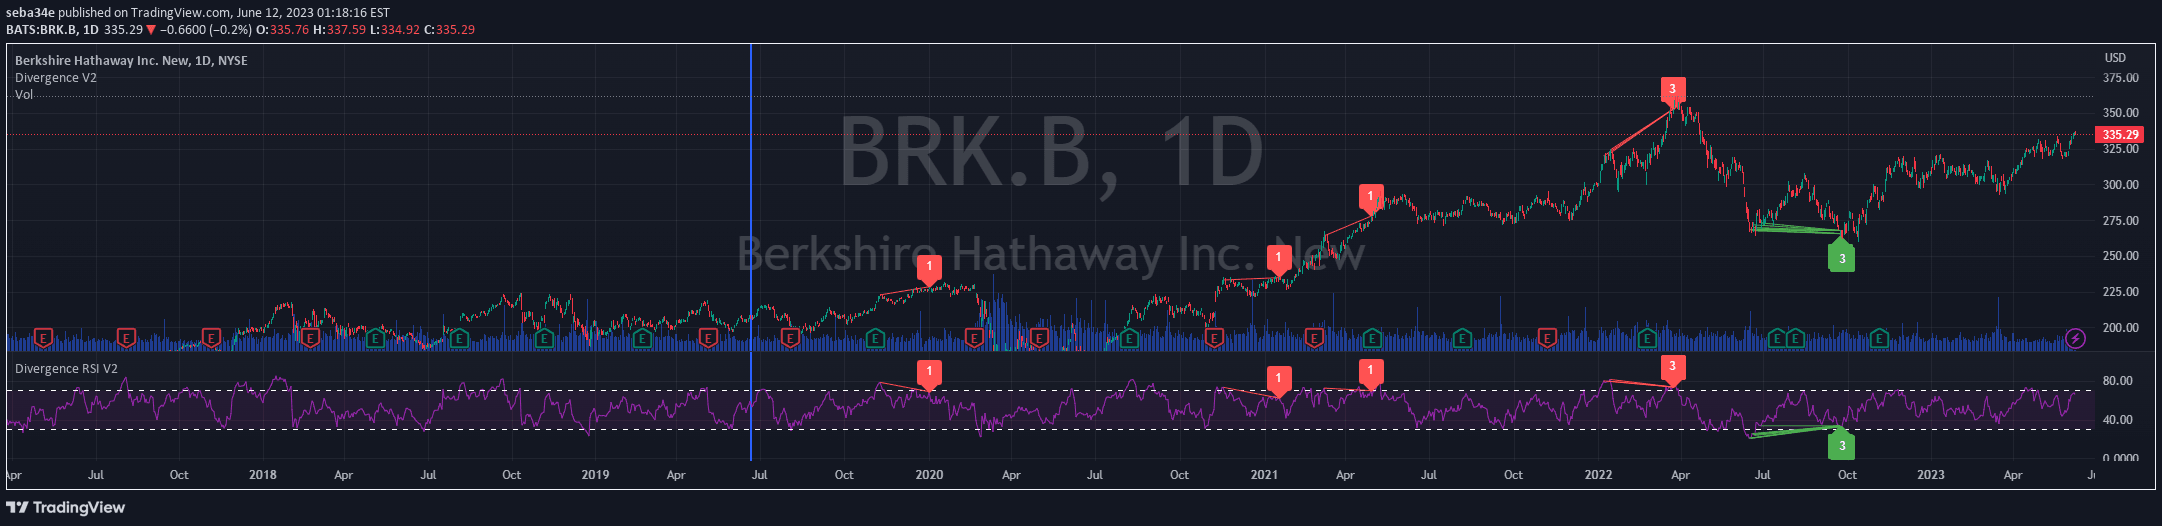
An RSI-based trading signal that identifies potential trend reversals using RSI levels, moving averages, and divergence patterns to generate precise entry and exit points.
Explore complementary indicator rolesHow it works
The signal mechanism relies on analyzing the Relative Strength Index (RSI) across multiple dimensions, specifically tracking its position relative to the 50 centerline and its own moving average. By examining both regular and hidden divergences, the indicator creates a comprehensive framework for identifying potential market turning points.
The system generates signals when specific conditions are met, such as the RSI being below or above the 50 level and simultaneously positioned below or above its moving average. These conditions are further validated by matching divergence patterns, which help confirm potential trend reversals or momentum shifts in the underlying asset.
Why it may be useful
Traders benefit from this signal because it provides a nuanced approach to momentum analysis, combining multiple technical indicators to improve signal reliability and reduce false entries. By integrating RSI levels, moving averages, and divergence patterns, the indicator offers a more sophisticated method of identifying potential trend changes compared to single-indicator approaches.
The multi-dimensional analysis helps traders filter out noise and focus on more meaningful market movements, potentially increasing the probability of successful trades. This approach allows for more precise timing of entries and exits, which can be particularly valuable in volatile or ranging market conditions.
When to explore it
The RSI-based signal works best in markets with clear momentum trends and sufficient price volatility, where oscillators can effectively capture short-term price dynamics. Traders should consider using this signal in liquid markets with consistent price movements, such as major forex pairs, stock indices, or actively traded commodities.
It is most effective when combined with additional confirmation tools like moving averages or trend-following indicators. Traders should be cautious during periods of extreme market uncertainty or low liquidity, where oscillator signals might generate less reliable results.
Keep exploring
What we’ve verified
Access, alerts and repainting behaviour have not been independently verified for this indicator. Check the creator’s current publication and settings.
General descriptions and classifications are recovered research. Verified details above identify the specific checks we have completed. Check the creator’s current publication for later changes.