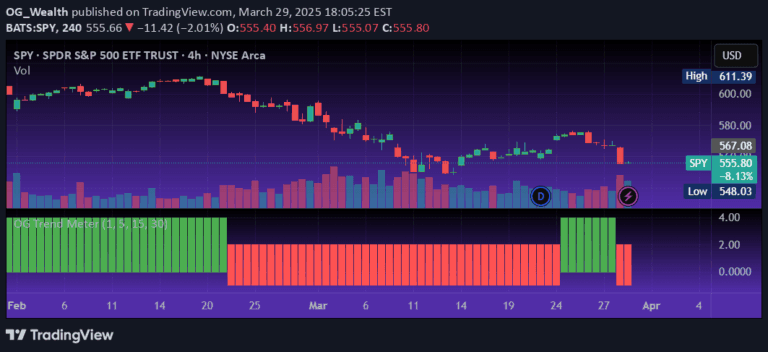
A comprehensive trading indicator combining trend oscillator and MACD analysis with divergence detection to provide multi-layered market insights and potential entry/exit signals.
Explore complementary indicator rolesHow it works
The indicator operates through two primary analytical engines: the Algorganic Typical Price Channel (ATPC) and an enhanced MACD system. The ATPC generates trend signals by tracking momentum and volatility using a normalized oscillator based on typical price, with key zones for overbought and oversold conditions.
The MACD component adds additional confirmation by overlaying a Donchian Midline to filter trend bias, with crossovers and histogram movements providing momentum insights. Divergence detection further enhances the system by identifying potential trend reversals where price action contradicts momentum indicators.
Why it may be useful
This multi-signal system provides traders with a comprehensive view of market dynamics, reducing the likelihood of false signals and enhancing trade decision-making. By combining trend, momentum, and divergence analysis, traders gain a more nuanced understanding of market psychology and potential trend shifts.
The indicator's flexibility allows adaptation across different trading styles and timeframes, offering valuable insights for scalpers, day traders, and swing traders alike. Its ability to detect hidden power shifts before price reacts gives traders a potential edge in anticipating market movements.
When to explore it
The indicator is most effective in markets with clear trending characteristics, where momentum and trend alignment can be reliably identified. It performs exceptionally well in liquid markets with sufficient price movement, such as major forex pairs, stock indices, and actively traded commodities.
Traders should prioritize using this tool during periods of established market trends, avoiding its signals during extremely choppy or range-bound market conditions. Optimal usage involves combining the indicator's insights with additional confirmation from volume, support/resistance levels, and broader market context.
Keep exploring
What we’ve verified
Access, alerts and repainting behaviour have not been independently verified for this indicator. Check the creator’s current publication and settings.
General descriptions and classifications are recovered research. Verified details above identify the specific checks we have completed. Check the creator’s current publication for later changes.