
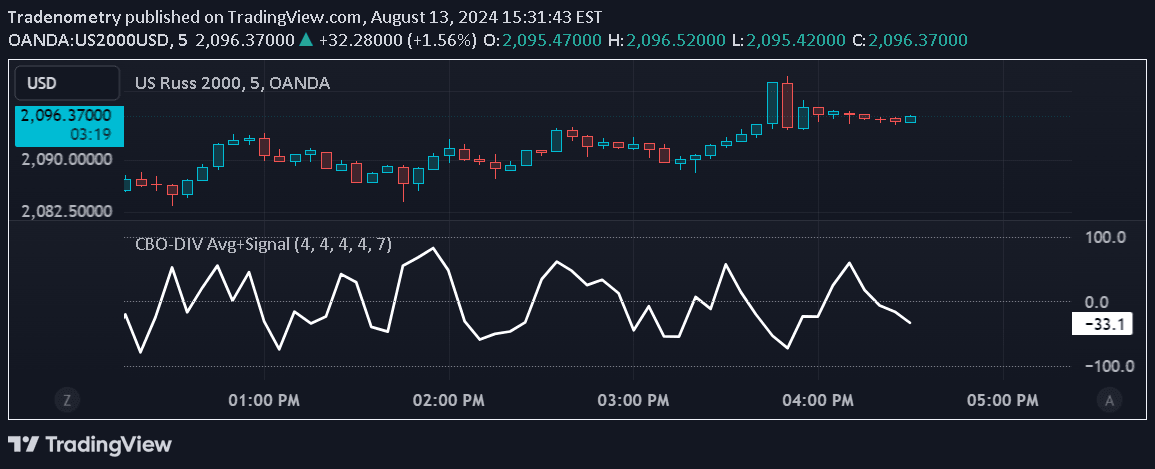
A complex market analysis tool combining a Custom Bias Oscillator with a Divergence Histogram to assess market momentum, bias, and potential trend reversals through advanced candlestick and volume analysis.
Explore complementary indicator rolesHow it works
The indicator operates by first calculating a Custom Bias Oscillator (CBO) that analyzes candlestick body and wick movements, normalized by Average True Range to account for market volatility. It integrates the Rate of Change (ROC) of volume with the adjusted bias to create a comprehensive market momentum assessment.
The system then generates a Divergence Histogram by comparing the CBO with its signal line, providing visual insights into potential market trend shifts. By calculating the average of the CBO and normalized divergence, the indicator creates a combined signal that offers traders a multi-dimensional view of market conditions, with an accompanying smoothed signal line to highlight potential entry and exit points.
Why it may be useful
This indicator provides traders with a sophisticated analytical tool that goes beyond traditional single-metric analysis by combining multiple market indicators into a comprehensive assessment. By integrating candlestick body analysis, volume dynamics, and trend momentum, it offers a more nuanced understanding of market movements and potential trend reversals.
The multi-layered approach allows traders to gain deeper insights into market psychology, identifying potential trend exhaustion and momentum shifts that might be missed by simpler indicators. Its adaptability across different timeframes and markets makes it a valuable tool for traders seeking a more holistic view of market conditions.
When to explore it
The indicator is most effective in markets with clear trending characteristics, where price movements and volume show consistent patterns. It performs exceptionally well in liquid markets like forex, major stock indices, and high-volume cryptocurrency pairs where volume and price dynamics are more predictable.
Traders should employ this indicator during periods of moderate to high market volatility, where its complex analysis can provide meaningful insights. It is particularly useful during market transition periods, such as potential trend reversals or when seeking confirmation of existing trend strength across different timeframes.
Keep exploring
What we’ve verified
Access, alerts and repainting behaviour have not been independently verified for this indicator. Check the creator’s current publication and settings.
General descriptions and classifications are recovered research. Verified details above identify the specific checks we have completed. Check the creator’s current publication for later changes.




