
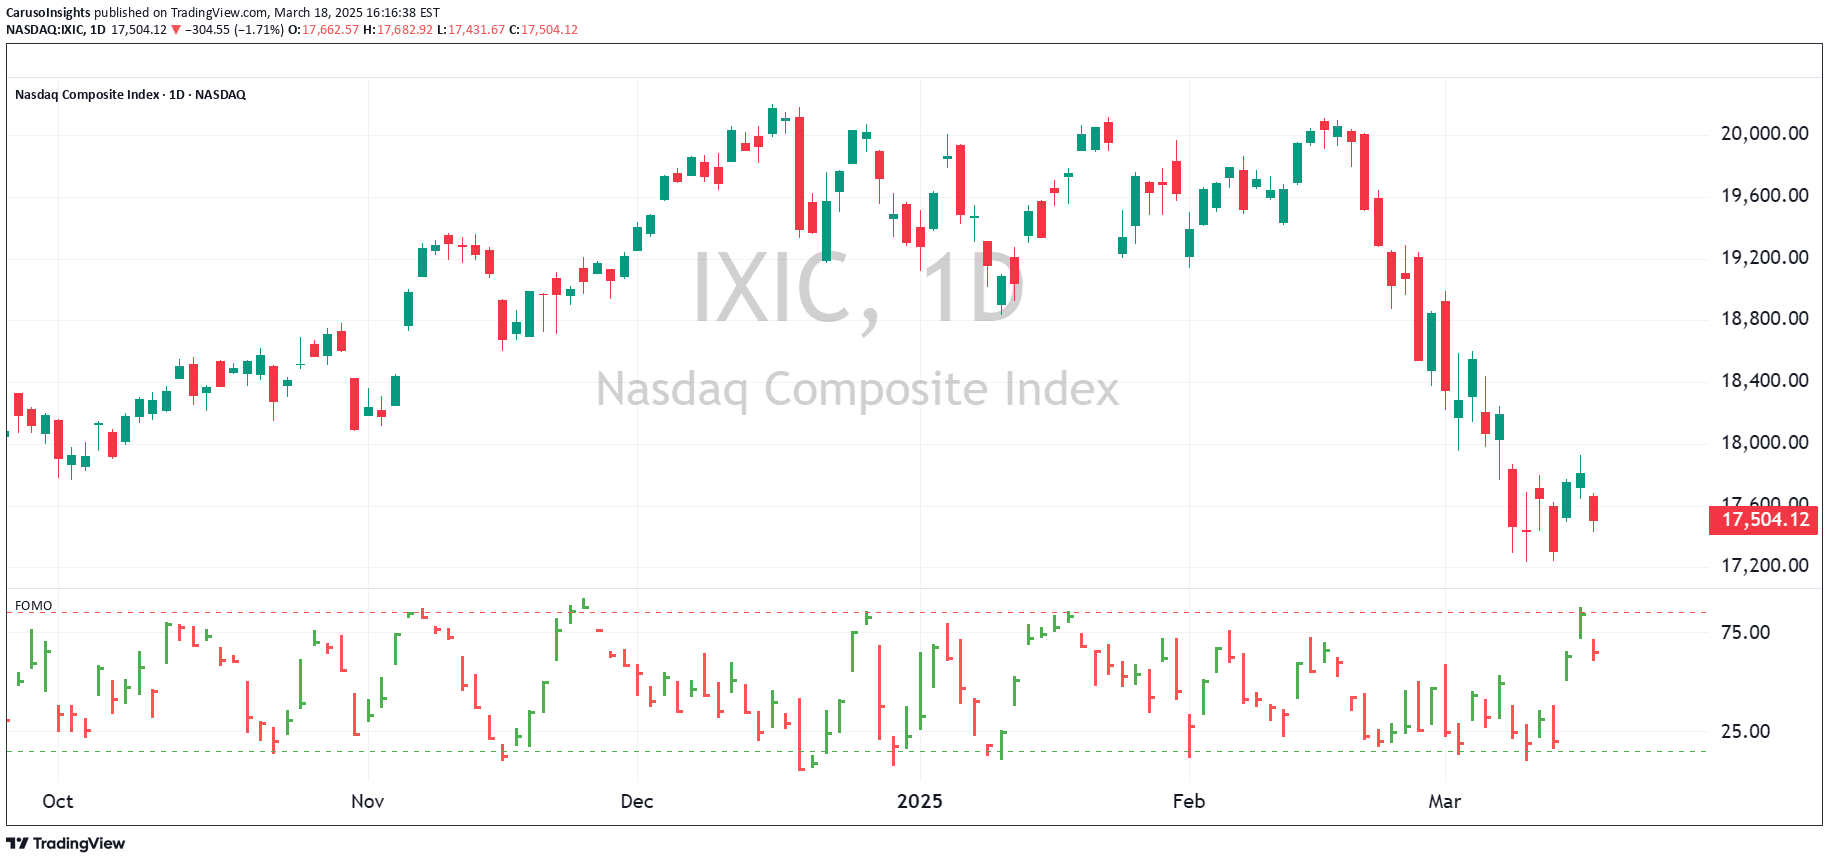
The FOMO Indicator tracks the percentage of Nasdaq and S&P 500 stocks trading above their 5-day moving averages, revealing short-term market sentiment and potential investor positioning.
Explore complementary indicator rolesHow it works
The FOMO Indicator calculates the percentage of stocks in the Nasdaq Composite and S&P 500 indices trading above their respective 5-day moving averages. By plotting these breadth indicators below the price chart, it provides a visual representation of market participation and momentum.
When the indicator shows over 85% of stocks above their 5-day averages, it signals widespread buying pressure, while levels below 15% suggest potential oversold conditions. Traders can quickly interpret these percentages to understand the short-term market sentiment and potential trend strength.
Why it may be useful
The FOMO Indicator offers traders a unique perspective on market-wide momentum and investor sentiment by aggregating stock performance across major indices. It provides a broader view of market dynamics beyond individual stock or index movements, helping traders identify potential trend shifts and market psychology.
By revealing the percentage of stocks participating in a particular trend, the indicator helps traders assess the underlying strength or weakness of current market conditions. This can be crucial for making more informed trading decisions and understanding the overall market sentiment.
When to explore it
The FOMO Indicator is most effective during short-term trading scenarios, particularly for scalping and day trading strategies. It works best when traders want to quickly assess market-wide momentum and identify potential entry or exit points based on broad market participation.
Traders should use this indicator in conjunction with other technical analysis tools to confirm signals and reduce false positives. It is particularly useful during volatile market conditions or when seeking to understand the collective behavior of stocks within major indices.
Keep exploring
What we’ve verified
Access, alerts and repainting behaviour have not been independently verified for this indicator. Check the creator’s current publication and settings.
General descriptions and classifications are recovered research. Verified details above identify the specific checks we have completed. Check the creator’s current publication for later changes.


