Day Trading Booster by DGT
Day Trading Booster is a comprehensive trading tool designed to help traders identify optimal market entry and exit points by analyzing trading sessions, market volumes, and key price levels.
Explore 11,183 indicators. Filter beyond the obvious.
Discover the tools that fit the way you trade.
11,183 tools to explore
Day Trading Booster is a comprehensive trading tool designed to help traders identify optimal market entry and exit points by analyzing trading sessions, market volumes, and key price levels.
A market structure indicator that identifies trend reversals and continuations by tracking protected highs and lows, helping traders recognize significant price movement shifts.
A market structure oscillator that analyzes short, intermediate, and long-term market trends to help traders identify potential trend shifts and momentum changes.
A dynamic support/resistance indicator that classifies strength levels from 1-10 using higher time-frame data, helping traders identify key price zones across different timeframes.
A comprehensive market analysis tool tracking price frequency and trading volume to reveal market dynamics, support/resistance levels, and fair value zones.
A market structure indicator that detects breaker blocks, extending swing levels and highlighting potential support/resistance zones through price interactions and breakout events.
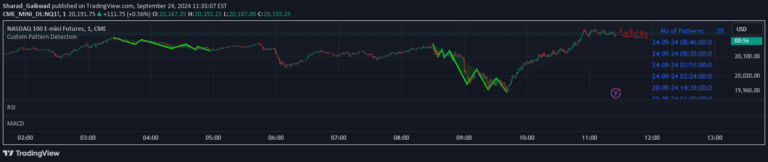
A customizable chart pattern detection tool that allows traders to define and identify specific pattern formations across multiple market scenarios using flexible input parameters.
A technical indicator that highlights previous day's high and low points, uses daily and weekly separators to create a clean chart that helps traders understand potential market direction.
A comprehensive trading tool that helps traders analyze oscillators by converting their values into a visual channel, revealing trend strength, divergences, and potential trading signals across various market conditions.
A TradingView Pine script that generates Supertrend Zone Pivot Points with non-repainting Zigzag and Fibonacci levels, helping traders identify key market turning points.
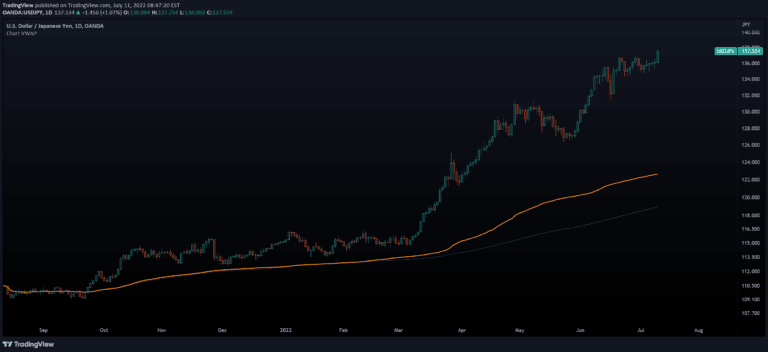
A dynamic Volume-Weighted Average Price (VWAP) indicator that calculates on visible chart bars, offering traders a flexible way to analyze price movement and volume across different chart views.
A dynamic trading indicator that automatically identifies supply and demand zones, helping traders detect potential price reversal areas by analyzing market volume and pivot points.
Likes, views, and comments are historical TradingView snapshots. They describe attention, not trading performance.