Adaptive Trend Finder (log)
The Adaptive Trend Finder is an advanced trading indicator that autonomously detects trend channels using logarithmic scale regression, offering flexibility in long-term or short-term trend analysis.
Explore 11,183 indicators. Filter beyond the obvious.
Discover the tools that fit the way you trade.
11,183 tools to explore
The Adaptive Trend Finder is an advanced trading indicator that autonomously detects trend channels using logarithmic scale regression, offering flexibility in long-term or short-term trend analysis.
An experimental trading signal applying the Logistic Map Equation to popular indicators like Awesome Oscillator, ROC, RSI, and Stochastic to generate unique market insights through iterative mathematical calculations.
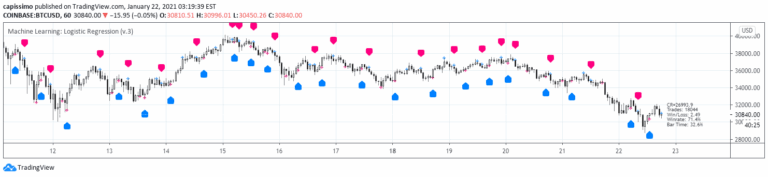
A machine learning strategy using logistic regression to classify market movements into binary categories by fitting a sigmoid curve to predict potential trading directions.
K-means clustering algorithm identifies potential support and resistance levels by grouping similar price data points, offering traders insights into market behavior and potential price reversals.
A statistical trailing stop tool that uses log-normal distribution of volatility to help traders lock in profits across different market conditions and trend strengths.
A sophisticated logistic regression indicator that identifies and predicts support and resistance levels using advanced statistical modeling and market condition analysis.
A psychological support/resistance indicator that identifies potential price reaction zones based on sequential candle movements and provides hypothetical support and resistance levels.
A unique trading tool that overlays momentum oscillators within a logarithmic regression channel, providing dynamic insights into price trends and momentum positioning.
An advanced 3D astrological trading indicator that renders planetary movements, aspects, and zodiac positions to provide unique market insights based on celestial body interactions.
A comprehensive trend-following indicator using moving averages to identify bullish and bearish market trends across different timeframes with color-coded visual alerts.
A long-term market cycle indicator that compares short and long moving averages to identify potential market tops and bottoms, especially for assets like Bitcoin.
A machine learning trading indicator using logistic regression that combines multiple technical indicators to generate potential buy and sell signals with systematic decision-making.
Likes, views, and comments are historical TradingView snapshots. They describe attention, not trading performance.